Quarterly Review

3 Market Insights for Investors in Q2 2024

2024 began with debates over a “soft” versus “hard” landing as the Fed attempted to stabilize the economy as well as over the sustainability of last year’s market rally. Only three months later, those concerns have given way to a calmer environment centered around fading inflation and the Fed’s plans for reducing interest rates. This has resulted in a strong market rally with the S&P 500 index, Dow Jones Industrial Average, and Nasdaq gaining 10.2%, 5.6%, and 9.1% year-to-date, respectively.


The economic environment has surprised many investors as inflation continues to fade. The Fed’s preferred measure of inflation, the Personal Consumption Expenditures index, rose 2.5% on a year-over-year basis for all prices and 2.8% when excluding food and energy, both significant improvements from their peaks only a year and a half ago. While some areas of inflation such as shelter and energy costs remain problematic, inflation is steadily moving back to the Fed’s long-term 2% target.


Meanwhile, unemployment is still under 4% despite layoffs in the tech sector, interest rates have been more stable with the 10-year Treasury yield around 4.2%, and stock market returns have broadened beyond artificial intelligence stocks. Despite these positive trends, some investors are concerned about the upcoming presidential election and the next phase of Fed policy. These worries are only amplified by the fact that the market is hovering near all-time highs.


In uncertain market environments, it’s more important than ever for investors to maintain a long-term perspective. Below are three key insights for understanding upcoming events and how they have historically affected investors.

1. Steady economic growth has driven markets to new all-time highs.

Click here for a PDF of this image.

The S&P 500 has achieved 20 new all-time highs so far this year despite the brief market pullback during the first two weeks of the year. While this is positive for investors, it is easy to worry that continued market growth may not be sustainable. Do new all-time highs mean that the market is due for a pullback?


While price swings are an unavoidable part of investing, and the market does experience pullbacks from time to time, history shows that markets also tend to rise over long periods. During a bull market cycle, major stock market indices will naturally spend a significant amount of time near record levels, as shown in the accompanying chart. For instance, 2021 experienced 70 days with the market closing at new all-time highs, adding to the hundreds that were achieved since 2013.


Taking a long-term perspective allows investors to benefit from these market trends without constantly worrying about when a pullback might occur. Holding an appropriately diversified portfolio can help investors to withstand market pullbacks without focusing too much on the exact level of the market.

2. Markets have rallied through both Democratic and Republican presidencies.

Click here for a PDF of this image.

Coverage of the presidential election is heating up ahead of the November rematch between Presidents Biden and Trump. While elections are an important way for Americans to help shape the direction of the country as citizens, voters and taxpayers, it’s important to vote at the ballot box and not with investment portfolios.


This is because history shows that markets can perform well under both Democrats and Republicans. As the accompanying chart shows, the economy and stock market have grown over decades regardless of who was in the White House. What mattered more across these periods were the ups and downs of the business cycle. The Clinton years, for instance, benefited greatly from the long expansion of the 1990s. The George W. Bush years, on the other hand, overlapped with both the dot-com crash and the 2008 global financial crisis. Business and market cycles defined their presidencies, and not the other way around.


Of course, politics can impact taxes, trade, industrial activity, regulations, and more. However, not only do these policy changes tend to be incremental, but also the exact timing and effects are often overestimated. Thus, it’s important to focus less on day-to-day election poll results and more on the long-term economic and market trends. Ideally, investors concerned about the impact of specific policies on their financial plans should speak with a trusted financial advisor.

3. The Fed is expected to cut rates as inflation stabilizes.

Click here for a PDF of this image.

The market rally broadened beyond mega-cap technology stocks in the first quarter. The equal weight S&P 500, an alternative to the standard market cap-weighted index, hit a new all-time high in early March, a sign that a wider range of stocks is performing well. The positive economic outlook and the possibility of rate cuts have boosted optimism across many parts of the market.


Given this backdrop, the Fed is expected to cut rates later this year although the timing remains uncertain. The accompanying chart shows the possible path of the federal funds rate based on the Fed’s latest projections, including three cuts this year. At its last meeting, the Fed cited strong job gains and low unemployment as indicators of solid economic activity but emphasized that “the Committee does not expect it will be appropriate to reduce [interest rates] until it has gained greater confidence that inflation is moving sustainably toward 2 percent.”


Regardless of the exact timing and path of Fed rate cuts, these projections represent a reversal of the emergency monetary policy actions that began in early 2022. For investors, it’s important to adapt to this changing environment and not focus solely on the events of the past few years.


The bottom line? With markets near all-time highs, a presidential election approaching, and Fed rate cuts expected to begin later this year, investors should stick to their financial plans while staying invested in the second quarter of the year. History shows that this is still the best way to achieve long-term financial goals.

Second Quarter 2023 In Review

Summary

The rally in the financial markets, which started in the first quarter, continued through the second quarter. The S&P 500 Index gained over 8%, the Dow rose over 3%, and the Nasdaq was up 15%. As of June 30th, these indices are up 15.9%, 3.8%, and 31.7%, respectively.

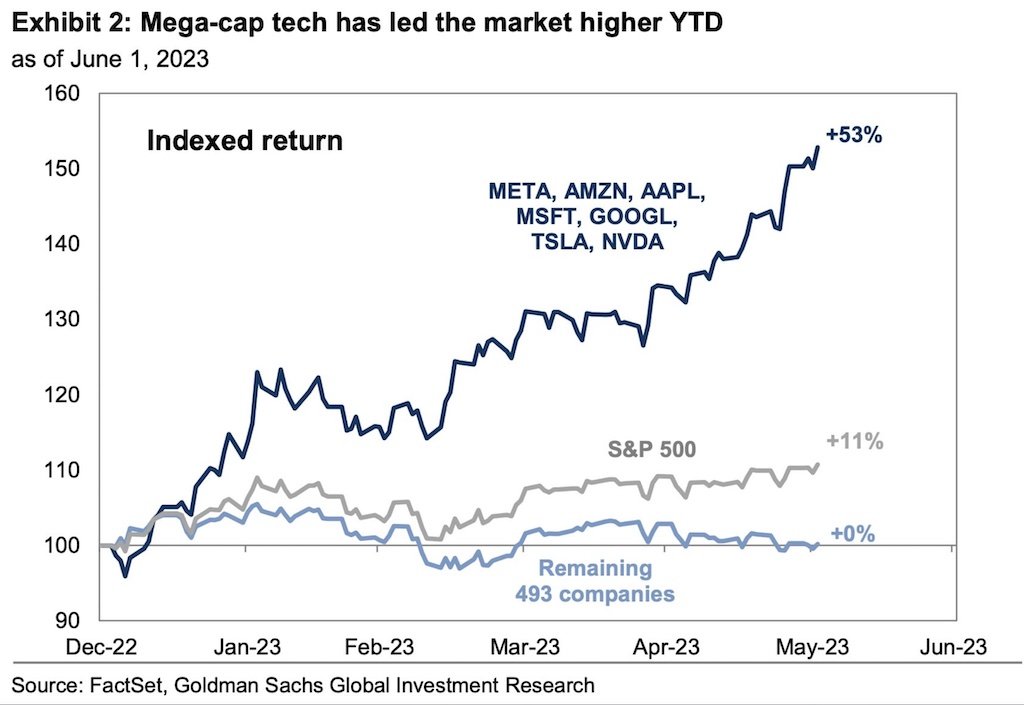
What's interesting is how much of the rally can be attributed to just seven mega-cap tech companies (Alphabet, Amazon, Apple, Meta, Microsoft, Nvidia, and Tesla):

Can't read this? Here's a link to a PDF of this chart.

As of June 1, the S&P 500 was up 11%. The seven companies referenced above, which I'll call the S&P 7, were up a whopping 53%. When you strip out the S&P 7, the remaining S&P 493 was flat over that period. 

The outperformance of the S&P 7 is amazing but not completely unexpected. Most of the tech companies saw steep declines in 2022, so there was a good chance they would bounce back. Add an A.I.-fueled frenzy and the timing was right for a significant rally in tech stocks.

Second Quarter 2023 Numbers

The average diversified U.S. stock fund, which is a better measure of how we invest than the S&P 500 or the Dow, rose just over 6% during the second quarter. Tack on the gain of just over 6% during the first quarter, and the average diversified U.S. stock fund is up over 12% as of June 30th.
 
International stocks also gained, with the average diversified international stock fund up nearly 3% during the second quarter. Adding the gain from the first quarter means the average international stock fund is up over 11% for the first half of the year. 

Investors, still risk-averse after pretty much everything lost money in 2022, plowed nearly $59 billion into bond funds during the second quarter. Over $44 billion was pulled out of U.S. funds and less than $1 billion made its way into international stock funds. The average intermediate-term bond fund lost just under 2.0% during the second quarter. Adding the gain from the first quarter leaves the average intermediate-term bond fund up just over 2% as of June 30th.

Returns By Broad Category

Can't read this? Here's a link to a PDF of this chart.

The chart above provides a high-level view of how the broad asset categories have fared annually from 2008 - 2022 and the first half of 2023 (the column labeled "YTD"). The category titled "Asset Alloc." refers to a 60% stock, 40% bond portfolio.

I love this chart and always look forward to seeing the updated version. Two takeaways:

  1. Notice any patterns? If you answered "yes", we need to talk because your brain operates on a different level than mine. It's impossible to consistently predict which categories will perform best from year-to-year or month-to-month.

  2. This chart is Exhibit A for why it's prudent to build diversified portfolios. Sadly, diversification means you're always having to say you're sorry because it's rare for every category to produce positive returns.

As far as the chart goes, the "winners" for the first half of 2023 are everything but commodities.

The "R" Word

I've had a few clients ask me about the dreaded "R" word (recession). I've seen dozens of stories predicting a recession later this year or sometime in 2024. When thinking about what's in store for investors, I try to keep in mind this quote from economist Paul Samuelson: "Economists have predicted 9 out of the last 5 recessions".

In other words, no one knows with 100% certainty when the next recession will hit. There will be another recession, but it could be later this year...or five years from now.

Rather than dwell on doom & gloom scenarios, and the many other uncertainties facing investors today, I recommend focusing on things you can control:

  1. Stick to your financial plan. If you're a client, you already have a financial plan in place - one that takes downturns into consideration. If you're still concerned, or if something in your life has changed, you can always contact me. Not a client? Feel free to schedule an initial consultation if you want to talk about creating a financial plan.

  2. Don't check your portfolio daily, weekly, or even monthly. Investing is a marathon, not a sprint.

  3. Steer clear of financial "news" from sources like CNBC.

  4. Have surplus cash to invest?* If so, just keep buying.

*Of course this comes after you've built up your emergency fund, saved for retirement, set aside money for other goals, and paid down debts.

First Quarter 2023 In Review

Summary

2022 ended and one could almost hear investors breathe a sigh of relief. 2023 got off to a good start, with financial markets rebounding from the lows in 2022. Megacap companies, such as Alphabet, Apple, Meta, and Microsoft led the way in the recovery as they reported mostly strong earnings, layoffs (reducing expenses), and, in the case of Alphabet and Microsoft, new artificial intelligence (AI) tools, such as ChatGPT (it's an interesting tool, one I've enjoyed playing with, but I don't think we have to bow before our new AI overlords...yet).

Things were humming along nicely until the threat of a new banking crisis formed as Silicon Valley Bank (SVB) failed due to a run on the bank. Think "It's a Wonderful Life" but with many more venture capitalists. That, of course, is an overly simplified version of what actually happened at SVB. Many individuals and businesses were impacted negatively by the bank run. Fortunately, the federal government stepped in to guarantee all deposits at SVB and Signature Bank, another bank that collapsed, before the contagion could spread.

While the banking crisis took over the news, the debt ceiling fight in Congress got pushed to the back burner. Expect to hear a lot more about this issue in the coming weeks. Let's hope our elected officials come to their senses before they harm the economy and financial markets.

The Federal Reserve continued raising interest rates throughout the first quarter as inflation continued to cool. Based on the most recent statement from the Fed, it appears they be nearing the end of this cycle of rate hikes.

Ultimately, it was a good quarter for global markets across the board.

First Quarter 2023 Numbers

If you recall, the average diversified U.S. stock fund, which is a better measure of how we invest than the S&P 500 or the Dow, was down over 18% for all of 2022. Finally some good news for investors: The average U.S. stock fund rose nearly 6% during the first quarter. Despite the gain, investors remained cautious about domestic stocks, pulling over $68 billion from funds in that category during the quarter.
 
International stocks, down 17% in 2022, also rose during the first quarter, with the average diversified international stock fund up a little over 8%, besting U.S. stocks. International stock funds saw inflows, over $10 billion, during the quarter.

Investors, concerned about U.S. stocks, invested nearly $67 billion into of bond funds during the first quarter. The average intermediate-term bond fund, down over 13% in 2022, gained about 3.0% during the first quarter.

Returns By Broad Category

Can't read this? Here's a link to a PDF of this chart.

The chart above provides a high-level view of how the broad asset categories have fared annually from 2008 - 2022 and the first quarter of 2023 (the column labeled "YTD"). The category titled "Asset Alloc." refers to a 60% stock/40% bond portfolio (often referred to as the 60/40 portfolio).

Year-to-date, the three top-performing categories are:

  1. International developed markets ("DM Equity",+8.6%).

  2. Large cap U.S. stocks (+7.5%).

  3. International emerging markets ("EM Equity", +4.0%).

Note how the average 60/40 portfolio's returns are squeezed in between Large Cap and EM Equity. The 60/40 portfolio isn't dead (it never was).

I love this chart and always look forward to seeing the updated version. Two takeaways:

  1. Notice any patterns? If you answered "yes", we need to talk because your brain operates on a different level than mine. It's impossible to consistently predict which categories will perform best from year-to-year or month-to-month.

  2. This chart is Exhibit A for why it's prudent to build diversified portfolios. Sadly, diversification means you're always having to say you're sorry because it's rare for every category to produce positive returns.

Update: Series I Bonds

Last year, from May 1, 2022 through October 31, 2022, Series I Bonds rates peaked at 9.62%. That was an amazing rate in year that was lousy for investors. Demand for bonds was so great that the TreasuryDirect website crashed.

The rate declined to 6.89% from November 1, 2022 through April 30, 2023. While not as good as 9.62%, 6.89% was still pretty good.

As the saying goes, all good things must come to an end: The new rate from May 1, 2023 through October 31, 2023 is 4.30%. Okay, this rate isn't that bad because Series I Bonds are extremely low-risk investments. The downside is the opportunity cost of investing in stocks, which had a higher return during the first quarter.

Does it make sense to invest additional money in I Bonds? If you bought I Bonds last year, should you continue to hold your I Bonds, or is it better to redeem your bonds and invest elsewhere?

Like many things in finance the answer is "it depends".

In general, Series I Bonds might be a good investment for you if:

  1. Your risk tolerance is relatively low. Perhaps you're a cautious investor who can't sleep at night when the market is volatile. Or maybe you're a retiree who needs to focus more on asset preservation rather than growth.

  2. You have surplus cash to invest. Let's say you've set aside enough cash to cover at least 3-6 months (or more!) of living expenses AND you are maxing out your retirement savings AND you are investing regularly in a taxable brokerage account. If you're doing all of those things and you still have cash left over than Series I Bonds might be a good, ow-risk investment.

  3. You don't need the cash for a 12 months, or longer. This one is important. The minimum holding period for Series I Bonds is 12 months. If you think you might need access to the cash earlier than 12 months, you should invest elsewhere.

It's impossible to capture everyone's unique situation using the three rules above. I'm happy to help you determine if Series I Bonds are right for you. Contact me if you want to chat.

Fourth Quarter & Full Year 2022 In Review

Summary

There's no way to sugarcoat it: 2022 was a lousy year for investors.

Here's how some of the big indices closed out the year:

  • S&P 500 Index (large cap U.S. stocks): -18.11%

  • Dow Jones Industrial Average (large cap U.S. stocks): -6.86%

  • Russell 2000 Index (small cap U.S. stocks): -20.44%

  • Nasdaq Composite Index (tech-heavy U.S. stocks): -33.10%

  • MSCI EAFE Index (international stocks): -14.45%

  • Barclays U.S. Aggregate (bonds): -13.01%

Despite posting net losses for the year, there was a ray of hope as most of the big indices actually rallied during the fourth quarter. The exception was the Nasdaq, which showed a slight loss:

  • S&P 500 Index (large cap U.S. stocks): 7.56%

  • Dow Jones Industrial Average (large cap U.S. stocks): 16.01%

  • Russell 2000 Index (small cap U.S. stocks): 6.23%

  • Nasdaq Composite Index (tech-heavy U.S. stocks): -1.03%

  • MSCI EAFE Index (international stocks): 17.34%

  • Barclays U.S. Aggregate (bonds): 1.87%

Way back in May, when it was obvious financial markets were really struggling, I wrote the following:

"Given the recent declines in the financial markets, I think it's a good time for a reminder: In the short run, investments don't always go up.

No one likes seeing losses in their portfolio, but it's unavoidable. Fortunately, we can zoom out and the long-term picture is an upward trend."

You can see this upward trend in action in this view of the S&P 500 Index from 1996 through 2022:

Can't read this? Here's a link to a PDF of this chart.

When looking at the chart, note the gains or losses for each of the green trend lines. Spoiler: The gains far outweigh the losses over this time period.


Full Year 2022 Numbers

The average diversified U.S. stock fund, which is a better measure of how we invest than the S&P 500 or the Dow, ended 2022 down just over 18%. Big tech stocks, such as Alphabet, Amazon, and Apple, were hit especially hard during the year, with the tech-heavy Nasdaq Composite Index down 33.1%. Investors, perhaps following a "buy the dip" approach, invested nearly $12 billion in U.S. stock funds during the year.
 
International stocks performed slightly less worse than domestic stocks, with the average diversified international stock fund down a hair over 17% during the year. Investors, perhaps spooked by geopolitical issues, appeared to have little faith in international stock funds. During the year, over $51 billion was withdrawn from funds in the category.

Bonds, typically considered "safe" investments, also had a lousy year. The average intermediate-term bond fund lost 13.5% during 2022. Investors, realizing bonds weren't "safe", pulled over $336 billion out of bond funds during the 2022.


Returns By Broad Category

Can't read this? Here's a link to a PDF of this chart.

The chart above provides a high-level view of how the broad asset categories have fared annually from 2008 - 2022.

The category titled "Asset Alloc." refers to a 60% stock, 40% bond portfolio. Note how the classic 60/40 portfolio, long considered an ideal allocation for retirees, was down nearly 14% in 2022. The financial media is on the case, writing articles with titles like, "Is the 60/40 Dead?" and "The 60/40 Portfolio is Officially Over". I disagree with those extreme takes, but my take, possibly titled "The 60/40 is Down This Year, But It's Fine - Especially If It's the Correct Allocation for Your Goals", won't generate clicks.

I love this chart and always look forward to seeing the updated version. Two takeaways:

  1. Notice any patterns? If you answered "yes", we need to talk because your brain operates on a different level than mine. It's impossible to consistently predict which categories will perform best from year-to-year or month-to-month.

  2. This chart is Exhibit A for why it's prudent to build diversified portfolios. Sadly, diversification means you're always having to say you're sorry because it's rare for every category to produce positive returns. This fact was especially true in 2022.

As far as the chart goes, the only "winners" for 2022 were commodities and cash, up 16.1% and 1.5%, respectively. 


What's Next?

No one can predict what 2023, and beyond, will mean for financial markets and investors, so I'll keep it simple and repeat some of the things I've said previously:

  1. Stick to your financial plan. If you're a client, you already have a financial plan in place - one that takes downturns into consideration. If you're still concerned, or if something in your life has changed, you can always contact me. Not a client? Feel free to schedule an initial consultation if you want to talk about creating a financial plan.

  2. Don't check your portfolio daily, weekly, or even monthly. Investing is a marathon, not a sprint.

  3. Steer clear of financial "news" from sources like CNBC.

  4. Have surplus cash? If so, take advantage of the decline in financial markets by investing while things are on sale.

Third Quarter 2022 in Review

Summary

Way back in March of 2020, when the S&P 500 index was down 26% year-to-date, I wrote that investing is hard. I then clarified what I meant:

"When I say 'investing is hard', what I really mean is that staying invested is hard."

That sentiment is still true today, especially when you consider how financial markets have performed so far this year. During the third quarter, the S&P 500 Index fell just over 5.0%, the Dow declined over 6.0%, and the Nasdaq dropped by nearly 4.0%. As of September 30th, these indices are down 23.6%, 19.4%, and 31.9%, respectively.

Ouch.

Even bonds, normally considered "safe" investments, are down. For example, the Bloomberg U.S. Aggregate Bond Index fell 4.75% in the third quarter...and is now down 14.6% for the year.

The only categories of investments that have worked this year are energy and commodities. Both are typically extremely volatile, so I don't recommend maintaining large positions in these categories.

Third Quarter 2022 Numbers

The average diversified U.S. stock fund, which is a better measure of how we invest than the S&P 500 or the Dow, fell about 4.5% during the third quarter. Tack on the losses from the first and second quarters, and the average diversified U.S. stock fund is down nearly 25% as of September 30th.
 
International stocks performed worse than domestic stocks, with the average diversified international stock fund down over 10% during the third quarter. Adding the losses from the first and second quarters, the average international stock fund is down over 32% as of September 30th. 

Investors pulled over $20 billion from both domestic and international categories.

Investors, perhaps realizing bonds weren't "safe", pulled nearly $34 billion out of bond funds during the third quarter. The average intermediate-term bond fund lost a little over 4.5% during the third quarter. When we add losses from the first and second quarters, the average intermediate-term bond fund is down 15% as of September 30th.

Returns By Broad Category

Can't read this? Here's a link to a PDF of this chart.

The chart above provides a high-level view of how the broad asset categories have fared annually from 2007 - 2021 and 2022 through September 30th (the column labeled "YTD").

The category titled "Asset Alloc." refers to a 60% stock, 40% bond portfolio. Note how the classic 60/40 portfolio, long considered an ideal allocation for retirees, is down nearly 20% YTD. The financial media is on the case, writing articles with titles like, "Is the 60/40 Dead?" and "The 60/40 Portfolio is Officially Over". I disagree with those extreme takes, but my take, possibly titled "The 60/40 is Down This Year, But It's Fine - Especially If It's the Correct Allocation for Your Goals", won't generate clicks.

I love this chart and always look forward to seeing the updated version. Two takeaways:

  1. Notice any patterns? If you answered "yes", we need to talk because your brain operates on a different level than mine. It's impossible to consistently predict which categories will perform best from year-to-year or month-to-month.

  2. This chart is Exhibit A for why it's prudent to build diversified portfolios. Sadly, diversification means you're always having to say you're sorry because it's rare for every category to produce positive returns.

As far as the chart goes, the only "winners" for 2022 are commodities and cash. Energy isn't broken out as a separate category.

Final Thoughts

I'll keep it simple and repeat some of the things I've said previously:

  1. Stick to your financial plan. If you're a client, you already have a financial plan in place - one that takes downturns into consideration. If you're still concerned, or if something in your life has changed, you can always contact me. Not a client? Feel free to schedule an initial consultation if you want to talk about creating a financial plan.

  2. Don't check your portfolio daily, weekly, or even monthly. Investing is a marathon, not a sprint.

  3. Steer clear of financial "news" from sources like CNBC.

  4. Have surplus cash? If so, take advantage of the decline in financial markets by investing while things are on sale.

Last Call for Series I Bonds at 9.62%

The current rate of 9.62% for Series I Bonds is available for purchases made by October 28, 2022. If you purchase by that date, you'll lock in the current rate for six months. If you buy after the 28th, you'll earn the new rate, which will be announced soon. I expect it to be high, but maybe not as high as 9.62%

If you're interested, here’s what you need to do:

  1. Go to https://www.treasurydirect.gov.

  2. Click on "Open an Account”.

  3. Follow the instructions to open the account and link a bank account. I believe Treasury Direct sent an email with the account number and another to verify the new account.

  4. Once the account has been opened, click on the “BuyDirect” tab near the top of the page.

  5. Select Series I bonds and hit submit.

  6. Input the amount you want to buy, up to $10K and hit submit. Notes:

    1. The $10K limit is per Social Security number, so each spouse/significant other/child can buy $10K.

    2. This also applies to trusts…if your trust has a different tax ID number than your own Social Security number.

    3. The limit is $10K per Social Security number/tax ID number per calendar year. That means you can buy up to $10K in 2022 and again in 2023. Again, if you have the cash.

    4. Important: The minimum holding period is 12 months.

    5. The current rate of 9.62% will be adjusted at the end of October. If you buy now, the rate of 9.62% is guaranteed for 6 months.

  7. Done! Enjoy earning 9.62%.


Aside from energy & commodities, this might be the best return investors see in 2022. The biggest hurdles are (a) having $10K+ in cash available and (b) the 12-month holding requirement. Otherwise, this is the safest, easiest way to invest right now.

Second Quarter 2022 In Review

Summary

Investors continued to endure a roller coaster ride in the financial markets during the second quarter. Unfortunately, the roller coaster was broken because it went mostly down. During the second quarter, the S&P 500 Index fell just over 16%, the Dow declined over 11%, and the Nasdaq dropped over 22%. As of June 30th, these indices are down 20.6%, 15%, and 32%, respectively.

No one likes seeing their investments decrease in value. But it happens. In fact, it happens every year. Check out this chart, which shows annual returns and intra-year declines in the S&P 500 from 1980 to 2021:

Can't read this? Here's a link to a PDF of this chart.

First, note the solid gray bars, which show the return of the S&P 500 Index every year from 1980 to 2021. Second, check out the red dots and numbers below the gray bars. The red numbers indicate the intra-year drops - the largest market drops during the year. As you can see, it's not unusual to experience a decline every year. Does this mean the S&P 500 Index, along with other indices and investments, will end the year in positive territory? No, but it is possible.

Second Quarter 2022 Numbers

The average diversified U.S. stock fund, which is a better measure of how we invest than the S&P 500 or the Dow, fell just over 16% during the second quarter. Tack on the loss of just over 6% during the first quarter, and the average diversified U.S. stock fund is down over 22% as of June 30th.
 
International stocks also declined, with the average diversified international stock fund down nearly 14% during the second quarter. Adding the loss from the first quarter, 8%, means the average international stock fund is also down over 22% for the first half of the year. 

Investors pulled money from both categories, over $17 billion and $25 billion, respectively.

Investors, perhaps realizing bonds weren't a safe haven, pulled nearly $146 billion out of bond funds during the second quarter. The average intermediate-term bond fund lost a little over 5.0% during the second quarter. When we add the first quarter loss, about 6%, that leaves the average intermediate-term bond fund down over 11% as of June 30th.

Perhaps the silver lining here, and this is really a stretch, is the loss in bond funds didn't match the loss of 22% found in both U.S. and international stock funds. I'm trying to be optimistic!

Returns By Broad Category

Can't read this? Here's a link to a PDF of this chart.

The chart above provides a high-level view of how the broad asset categories have fared annually from 2007 - 2021 and the first half of 2022 (the column labeled "YTD"). The category titled "Asset Alloc." refers to a 60% stock, 40% bond portfolio.

I love this chart and always look forward to seeing the updated version. Two takeaways:

  1. Notice any patterns? If you answered "yes", we need to talk because your brain operates on a different level than mine. It's impossible to consistently predict which categories will perform best from year-to-year or month-to-month.

  2. This chart is Exhibit A for why it's prudent to build diversified portfolios. Sadly, diversification means you're always having to say you're sorry because it's rare for every category to produce positive returns.

As far as the chart goes, the only "winners" for the first half of 2022 are commodities and cash.

Final Thoughts

Last quarter, I wrote, "If there's one thing investors hate, it's uncertainty." Well, that statement is still true. Investors continue to grapple with the following questions:

  • When will inflation reverse course? Spoiler: Not yet. The U.S. inflation rate was 9.1% in June, the highest on record since November of 1981.

  • How much will the Fed have to raise interest rates to get inflation under control? It depends on the monthly inflation numbers. I expect rate increases to become smaller, and eventually decline, once monthly inflation number shows a consistent downward trend.

  • When will problems with the supply chain end? September 17th, 2022. Just kidding. No one knows, but seems as if the situation is beginning to improve, especially now that COVID-related disruptions are on the decline.

  • What's the deal with Elon Musk? I have no idea.

Rather than dwell on these questions, and the many other uncertainties facing investors today, I recommend focusing on things you can control:

  1. Stick to your financial plan. If you're a client, you already have a financial plan in place - one that takes downturns into consideration. If you're still concerned, or if something in your life has changed, you can always contact me. Not a client? Feel free to schedule an initial consultation if you want to talk about creating a financial plan.

  2. Don't check your portfolio daily, weekly, or even monthly. Investing is a marathon, not a sprint.

  3. Steer clear of financial "news" from sources like CNBC.

  4. Have surplus cash? If so, take advantage of the decline in financial markets by investing while things are on sale.

First Quarter 2022 In Review

Summary

Investors endured a lot over the last three years: A global pandemic (which is still hanging around), supply chain problems (also still here), rising inflation (probably still rising), and Elon Musk's shenanigans (no sign of stopping). Despite all of those things, global financial markets were surprisingly resilient, delivering three straight years of big gains. In case you need a refresher, the S&P 500 Index, a reasonable proxy for "The Market", had the following returns over the past three years:

  • 2019: 31.49%

  • 2020: 18.40%

  • 2021: 28.71%

2022 got off to a decent start. People were vaccinated, shutdowns were easing, and people were starting to travel again. Sure, the problems listed above were still with us, and the Fed was threatening to raise interest rates in order to combat inflation, but things were looking up. Unfortunately, I don't think many people had "Russia invades Ukraine" on their bingo cards.

If there's one thing investors hate, it's uncertainty. And the invasion injected plenty of uncertainty into people's everyday lives as supply chains were strained further, global payment systems were disrupted, and energy prices skyrocketed. Tack on rate hikes from the Fed and the result was a decline in stocks and bonds during the first quarter, with the Dow Jones Industrial Average down 4.6% and the S&P 500 down 4.9%.

No one likes seeing their investments decrease in value. But it happens. I believe this time might feel worse because we've had such an incredible run over the past three years. Hang in there. Everything will be fine.

First Quarter 2022 Numbers

The average diversified U.S. stock fund, which is a better measure of how we invest than the S&P 500 or the Dow, fell just over 6% during the first quarter.
 
International stocks also declined, with the average diversified international stock fund down a little over 8% during the first quarter.

Despite the declines in both domestic and international stocks, investors plowed money into both categories, about $70 billion and $31 billion, respectively.

Investors, perhaps realizing bonds weren't a safe haven, pulled nearly $89 billion out of bond funds during the first quarter. The average intermediate-term bond fund lost almost 6.0% during the first quarter.

Returns By Broad Category

Can't read this? Here's a link to a PDF of this chart.

The chart above provides a high-level view of how the broad asset categories have fared annually from 2007 - 2021 and the first quarter of 2022 (the column labeled "YTD"). The category titled "Asset Alloc." refers to a 60% stock/40% bond portfolio.

I love this chart and always look forward to seeing the updated version. Two takeaways:

  1. Notice any patterns? If you answered "yes", we need to talk because your brain operates on a different level than mine. It's impossible to consistently predict which categories will perform best from year-to-year or month-to-month.

  2. This chart is Exhibit A for why it's prudent to build diversified portfolios. Sadly, diversification means you're always having to say you're sorry because it's rare for every category to produce positive returns.

Series I Bonds

Over the past few weeks I've received many inquires about Series I Bonds. Why? Because the current interest rate, through April, is 7.12%. That's a fairly amazing rate for what is nearly a risk-free investment.

Should you buy I Bonds? Like many things in finance the answer is "it depends".

I Bonds might be a good investment for you if:

  1. You have set aside enough cash to cover at least 3-6 months (or more!) of living expenses.

  2. You can afford to hold the I Bonds for 12 months, which is the minimum holding period.

Three more things:

  1. The maximum amount you can purchase is $10,000/year per person. That means a couple can purchase up to $20,000/year.

  2. The actual details about how much you can purchase are a bit complicated. I don't want to confuse the situation by adding those details here, so please do not send me an email that starts off with something like "Well, actually...." because I'll roll my eyes and get angry. And you wouldn't like me when I'm angry.

  3. I'm happy to help you determine if I Bonds are right for you. Contact me if you want to chat.

Fourth Quarter & Full Year 2021 In Review

Summary

In general, I believe 2021 was an improvement over 2020. COVID is still with us, but vaccines and healthcare workers, with improved knowledge about how to help the sick, made life feel somewhat normal again. Travel, even if somewhat limited, was possible and Costco had toilet paper in stock. Unfortunately, broken supply chains and staffing shortages were common throughout 2021 and will continue into 2022.

Inflation became a major topic of news headlines throughout the year. How high will it go? Answer: 6.9% annualized in CPI in November. Is it transitory? Answer: It depends on what the meaning of the word "transitory" is. For what it's worth, I don't expect hyperinflation. I believe what we're seeing is a result of a global pandemic, supply chain problems, and a labor shortage. Prices of goods and services will rise, and stay that way because no one lowers prices, but I doubt we'll see runaway inflation.

On the bright side, investors experienced a rare treat in 2021: The third straight year of big gains. The S&P 500 Index, a reasonable proxy for "The Market", had the following returns over the past three years:

  • 2019: 31.49%

  • 2020: 18.40%

  • 2021: 28.71%

The last time investors experienced returns similar to this was just before the Dot-Com bubble burst in early 2000:

  • 1995: 37.58%

  • 1996: 22.96%

  • 1997: 33.36%

  • 1998: 28.58%

  • 1999: 21.04%


An optimist will compare these periods and come to the conclusion we're in for another year of great returns. A pessimist will say a correction is imminent. Which one is correct? I don't know, but this is a good time to remind you that past performance is no guarantee of future returns.


Fourth Quarter 2021 Numbers

The average diversified U.S. stock fund, which is a better measure of how we invest than the S&P 500 or the Dow, gained nearly 7% during the fourth quarter. In total, the gain for the year was nearly 23%. This is especially impressive considering the average U.S. stock fund gained just over 19% in 2020 and over 28% in 2019. As I mentioned above, gains of ~20%+ for three years in a row are rare and may not necessarily continue. But they could! We'll find out in a little less than 12 months.
 
International stocks also performed well, just not as impressively as domestic stocks: The average diversified international stock fund gained a little over 2% during the fourth quarter, which translated to a gain of nearly 10% for the year.

Investors were cautious, pouring nearly $600 billion into bond funds during 2021. Unfortunately, the average intermediate-term bond fund lost 0.2% during the fourth quarter, which increased the overall loss to 1.3% for the year.


Returns By Broad Category

Can't read this? Here's a link to a PDF of this chart.

The chart above provides a high-level view of how the broad asset categories have fared annually from 2007 - 2021. The category titled "Asset Alloc." refers to a 60% stock/40% bond portfolio.

I love this chart and always look forward to seeing the updated version. Two takeaways:

  1. Notice any patterns? If you answered "yes", we need to talk because your brain operates on a different level than mine. It's impossible to consistently predict which categories will perform best from year-to-year or month-to-month.

  2. This chart is Exhibit A for why it's prudent to build diversified portfolios. Sadly, diversification means you're always having to say you're sorry because it's rare for every category to produce positive returns.


What's Next?

I dislike making predictions about the financial markets or the economy, but here are my five of my best guesses for the coming year:

  1. Volatility in the financial markets will continue. Investors should stay calm and stick to their financial plan.

  2. The Fed will raise interest rates 3-4 times during 2022.

  3. With rising rates, investors may shift assets from growth stocks to traditional value stocks.

  4. Inflation fears will continue to drive headlines, but will ultimately settle in around 3-4%.

  5. Digital assets, AKA crypto, will continue to attract money from investors and scrutiny from regulators. The technology and its uses will evolve rapidly as some projects die and other emerge.

Third Quarter 2021 In Review

Summary

My favorite time of the year is finally here! I always look forward to cool weather, scary movies, Oktoberfest beers, and apple season.

While the run-up in the financial markets continued for much of the summer, the third quarter ended with an increase in volatility and with stocks finally pulling back from all-time highs. It was a good reminder that stocks don't always go up.

As I've written previously, September is often the worst-performing month for investors. Whether or not the September Effect is real is debatable, but this September certainly wasn't kind to investors.

I suspect volatility will continue as the world grapples with, among other things, unnecessary drama from our elected officials, COVID-19 and its variants, reluctance by (too) many to get vaccinated, ongoing supply chain woes, and employment/staffing hiccups.

Third Quarter 2021 Numbers

The average diversified U.S. stock fund, which is a better measure of how we invest than the S&P 500, declined about 1.0% during the third quarter of 2021. As I mentioned above, September was a rough month for investors, with the average U.S. stock fund dropping 4.0% during that month alone. When the first and second quarter returns are added to the third, the average diversified U.S. stock fund is up 14.5% as of September 30. Investors, perhaps concerned about continuing to invest at all-time highs, pushed only $9 billion into U.S. stock funds during the quarter.

International stocks were also down for the quarter: The average diversified international stock fund lost about 1.8%. As of September 30th international stocks are up 7.1%. Investors demonstrated more confidence in international stock funds by investing $59 billion in those funds during the quarter.

The average intermediate-term bond fund rose a whopping 0.01% during the third quarter. Overall, bond funds are still negative for the year, at just over 1.1%. Despite low/negative returns, investors plowed nearly $129 billion into bond funds over the three-month period.

Returns By Category

Need a magnifying glass to read this? No problem. Here's a link to a PDF of this chart.

The chart above provides a high-level view of how the asset categories performed for the years 2018 to 2020, January through September 2021, and year-to-date 2021.

I love this chart and always look forward to seeing the updated version. Two takeaways:

  1. Notice any patterns? If you answered "yes", we need to talk because your brain operates on a different level than mine. It's nearly impossible to consistently predict which categories will perform best from year-to-year or month-to-month.

  2. This chart is Exhibit A for why it's prudent to build diversified portfolios. Sadly, diversification means you're always having to say you're sorry because it's rare for every category to produce positive returns.

Fourth Quarter And Beyond

No one can predict what's in store for financial markets, but here are some things likely to affect investors in the coming months:

  1. Interest rates. Fed officials have signaled they might raise interest rates in 2022. Investors shrugged when this announcement was made, but I won't be surprised if the market reacts negatively when rates are actually increased.

  2. Supply chain woes. Looking for a new car? Good luck. Hoping to score a PlayStation 5? I assume I'll be able to buy one when the PlayStation 6 is announced. Consumers will probably continue to have a difficult time buying many products due to semiconductor shortages, staffing problems, and COVID-related closures.

  3. Inflation. Is inflation truly transitory, or short-term, as the Fed and many economists would have us believe? We'll see. In the end, it might depend on your definition of short-term.

  4. Regulation of cryptocurrencies. Will the U.S. of other governments move to regulate or ban cryptocurrencies? Or will there be a flood of new investment products and services. Time will tell, but I think an outright ban, at least in the U.S., is unrealistic because of the amount of money currently invested in the space.

Downtime

Here are some things that have my attention when I'm not working:

  1. Listening:

    1. Podcasts: The two podcasts I look forward to every week are Animal Spirits and The Compound & Friends. Both shows cover a wide range of financial topics, such as the economy, investing, and taxes.

    2. Audiobooks: I'm currently listening to The Exponential Age: How Accelerating Technology is Transforming Business, Politics, and Society by Azeem Azhar, which has been interesting because I think humans have a difficult time understanding how exponential growth can affect things. I'm also re-listening to Snow Crash by Neal Stephenson. For a book published way back in 1992, it's amazing how much Stephenson got right about the internet, A.I. assistants, and the Metaverse.

  2. Watching:

    1. Squid Game. I just started watching this Korean series on Netflix. So far, it's great. Not for the squeamish.

    2. Midnight Mass. This one's also on Netflix. Highly recommended for fans of scary movies or anything influenced by Stephen King.

First Quarter 2021 In Review

Summary

For investors, 2021 is off to a good start. That doesn't mean the first three months of the year have been smooth sailing. Despite hitting all-time highs, financial markets saw some big swings during the first quarter. The volatility might have made you nervous. That's understandable. Keep in mind that big swings are normal. Stocks don't always go up.

The gains in the prices of stocks, housing, and cryptocurrencies have caused some investors, economists, and financial pundits to bring up the dreaded b-word, bubble, again and again. Is this a bubble? I don't know. No one knows. Anyone who tells you they know this is a bubble, and when it will burst, is lying.

Here's what we do know, with at least a reasonable degree of certainty:

  • The COVID vaccines continue to be produced, shipped, and processed throughout the U.S. and the world

  • Vaccinated people will be able to slowly resume normal activities

  • Employment will pick up

  • The economy will continue to recover

  • Unless your life situation or goals have changed, you should stick to your financial plan, which includes maintaining a properly diversified portfolio of investments

First Quarter 2021 Numbers

The average diversified U.S. stock fund, which is a better measure of how we invest than the S&P 500 or the Dow, gained about 8.5% during the first quarter of 2021. Small cap stocks continued to shine, outperforming all other investment categories during the quarter. Investors, optimistic about a recovery, pushed $78 billion into U.S. stock funds.

International stocks were also up for the quarter: The average diversified international stock fund rose about 3.5%. Investors demonstrated confidence in international stocks funds by investing a little over $27 billion in those funds during the quarter.

The average intermediate-term bond fund declined nearly 3.0% during the first quarter. Despite the decline, investors plowed nearly $2255 billion into bond funds over the three-month period.

Returns By Category

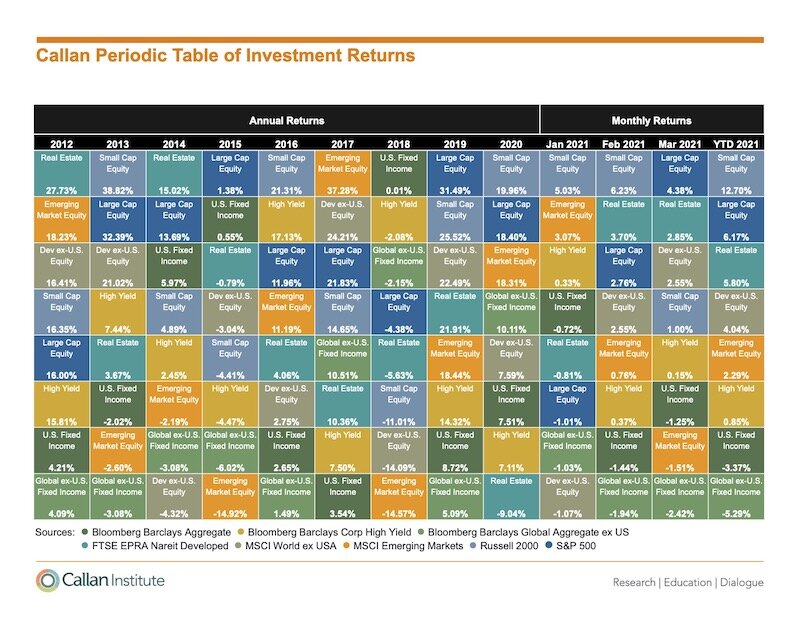
Callan March 2021 Monthly Periodic Table.jpg

Need a magnifying glass to read this? No problem. Here's a link to a PDF of this chart.

The chart above provides a high-level view of how the asset categories performed for the years 2012 to 2020, January through March 2021, and year-to-date 2021.

I love this chart and always look forward to seeing the updated version. Two takeaways:

  1. Notice any patterns? If you answered "yes", we need to talk because your brain operates on a different level than mine. It's nearly impossible to consistently predict which categories will perform best from year-to-year or month-to-month.

  2. This chart is Exhibit A for why it's prudent to build diversified portfolios. Sadly, diversification means you're always having to say you're sorry because it's rare for every category to produce positive returns.

Market Volatility and Investing

invest-long-term.jpg

Need a magnifying glass to read this? No problem. Here's a link to a PDF of this chart.

In the Summary I noted the financial markets were volatile during the first quarter of 2021. In order to reinforce my comments about (a) ignoring short-term volatility and (b) maintaining a well-diversified portfolio, I'm sharing a chart from BlackRock.

The chart shows 1-year returns of stocks from 1930 - 2020. The obvious takeaway is that there are far more years with positive returns than negative. Less obvious, but perhaps more important to keep in mind, is that for any given year the markets probably had wild swings from day-to-day. Hang on and stick to your plan.

Finally, a client asked me to include a reference to WandaVision in my next post. So.....

giphy.gif

2020 In Review; Or, It's the End of the World As We Know It (and My Portfolio Feels Fine)

Summary

2020 is finally over. And what a year it was! Among other things, we experienced:

  • A global pandemic

  • Virtual learning for many students

  • A significant decline in financial markets

  • The most rapid onset of unemployment in U.S. history

  • The release of a stimulus bill

  • A significant recovery/increase in financial markets

  • A presidential election

  • The creation, testing, and approval of multiple vaccines for COVID-19

  • Zoom fatigue

Despite all of that, the financial markets performed surprisingly well during 2020.

The previous sentence will provide little solace to anyone who (a) didn't own any investments during 2020, or (b) experienced unemployment due to COVID-19. If you owned investments andmaintained your job during 2020, this is a reminder of just how fortunate you are.

2020 Numbers

The average diversified U.S. stock fund, which is a better measure of how we invest than the S&P 500 or the Dow, gained more than 19% during 2020. This is remarkable considering the S&P 500 plummeted more than 34% over just 23 trading days in 2020, which is the fastest decline of that magnitude in history. Investors, justifiably spooked, pulled $258 billion from US stock funds during 2020.

International stocks also had a good year: The average diversified international stock fund rose nearly 13%. Investors demonstrated more confidence in international stocks funds by pulling out only $108 billion out of those funds during the year.

The average intermediate-term bond fund gained just over 8.0% during 2020. In a flight to safety, investors plowed nearly $445 billion into bond funds during the year.

Returns By Category

Callan-December-2020-Monthly-Periodic-Table.jpg

Need a magnifying glass to read this? No problem. Here's a link to a PDF of this chart.

The chart above provides a high-level view of how the asset categories performed monthly from January - December 2020 and for the full year of 2020.

I love this chart and always look forward to seeing the updated version. Two takeaways:

  1. Notice any patterns? If you answered "yes", we need to talk because your brain operates on a different level than mine. It's nearly impossible to consistently predict which categories will perform best from year-to-year or month-to-month.

  2. This chart is Exhibit A for why it's prudent to build diversified portfolios. Sadly, diversification means you're always having to say you're sorry because it's rare for every category to produce positive returns.

Winners and Losers

Here's what worked (winners) and what didn't (losers) in 2020:

For example, it's now obvious to investors that companies in the information technology category, such as Apple, Microsoft, and Zoom, performed well during 2020. While COVID-19 spread, employers and consumers had to rely on these companies for their work-from-home and entertain-from-home needs.

Another example of a winning category includes companies in the consumer discretionary sector. Stuck at home, consumers spent more money at online retailers like Amazon and Target. Home improvement companies, such as Home Depot and Lowes, also received a big boost as consumers spent time and money improving living spaces and upgrading home offices.

On the losing side, companies in the real estate sector had a rough year (see the chart above). Specifically, companies involved in commercial real estate lost business due to COVID-19-related slowdowns/shutdowns.

In retrospect, it's obvious why certain broad categories of investments or even specific companies were successful last year. During 2020, while so much about COVID-19 was unknown, it was nearly impossible to make these kinds of calls. Sure, minor course corrections could be made throughout the year, but knowing what to do with a high degree of certainty cannot be done consistently.

In March of 2020 I wrote that investing is hard. The takeaway from that post, focus on what you can control, is still true today.

2021

Sadly, my palantir is broken so I cannot tell you exactly what will happen in 2021. Here are some thoughts:

  1. Barring further shenanigans or acts of insurrection, Joe Biden will be inaugurated on Wednesday, January 20th, 2021. The world will not end, as some have predicted. Nor will the U.S. suddenly become a liberal paradise, as others have predicted. Mr. Biden and his administration will do some good things and some bad things. Given the state of the U.S., it will be an extremely difficult job.

  2. Another round of stimulus is likely to be passed in the weeks or months after Inauguration Day. The exact form, such as direct payments to taxpayers or infrastructure spending, is still up in the air.

  3. There will be changes to taxes and regulations. These changes won't cause the end of the world.

  4. Doses of the vaccines will continue to be produced and distributed, which will mean businesses and schools will be able to reopen. The economy will slowly recover for everyone.

  5. As usual, investors will adapt to the changes listed above.

  6. Minor course corrections to one's portfolio are appropriate, but you should stick to your financial plan.

  7. Whenever I need a laugh I will re-watch an episode or two of Ted Lasso on Apple TV+. I suggest you do the same.

  8. If you're a regular reader, you know that I often insert references to Star Wars or other pop culture sources. I'm a nerd, so that's not going to change. This is the way.

Some Reminders

  1. Wear a mask.

  2. Wash your hands.

  3. Get some exercise. Every. Day.

  4. Limit your social media intake. More specifically, don't get your news from social media.

  5. Read a book.

Third Quarter 2020 In Review

Summary

Well, the third quarter is behind us. We just have to make it through three more months and then we can put 2020 behind us...unless, as in the comedy Palm Springs, this turns out to be "one of those infinite time-loop situations you might have heard about". Let's hope not.

The financial market performed surprisingly well during July and August. Unfortunately, September must have been sponsored by Debbie Downer because everything went south. Could this be attributed to The September Effect, which I wrote about last month? I don't know, but it's certainly another data point in favor of that particular market anomaly.

On the bright side, the first few days of October have given investors some positive returns. Will the trend continue? I don't know. My guess is that the rollercoaster ride will continue, especially as Election Day approaches. Uncertainty, which is still my contender for Word of the Year, isn't going away anytime soon. Hang in there.


Third Quarter 2020 Numbers

The average diversified U.S. stock fund, which is a better measure of how we invest than the S&P 500 or the Dow, gained more than 7% during the third quarter. In case you've forgotten, the average U.S. stock fund was down 25% during the first quarter and then up 24% during the second quarter. This is remarkable considering we're still in the middle of a pandemic and a train wreck of an election. Investors, justifiably spooked, pulled $121 billion from US stock funds during the third quarter.
 
International stocks fared about the same: The average diversified international stock fund rose nearly 7%, which follows a loss of 23% during the first quarter and a gain of 18% during the second quarter. Investors demonstrated more confidence in international stocks funds by pulling out only $17 billion out of those funds during the third quarter.

The average intermediate-term bond fund gained almost 1.0% during the third quarter, which added to its gain of 0.4% during the first quarter and 5% during the second. In a flight to safety, investors plowed nearly $218 billion into bond funds during the third quarter.


Returns By Broad Category

Callan-September-2020-Monthly-Periodic-Table.jpg

Need a magnifying glass to read this? No problem. Here's a link to a PDF of this chart.

The chart above provides a high-level view of how the broad asset categories have fared annually from 2017 - 2019, monthly from January - September 2020 and year-to-date 2020. 

I love this chart and always look forward to seeing the updated version. Two takeaways:

  1. Notice any patterns? If you answered "yes", we need to talk because your brain operates on a different level than mine. It's impossible to consistently predict which categories will perform best from year-to-year or month-to-month.

  2. This chart is Exhibit A for why it's prudent to build diversified portfolios. Sadly, diversification means you're always having to say you're sorry because it's rare for every category to produce positive returns.


How Will The Election Affect The Market?

Every journalist, pundit, politician, and Average Joe/Jane has an opinion about how the election and the next president will affect the financial market. The reality is that no one knows what's going to happen in the coming weeks and beyond. Below, you'll find some information about what has happened in the past and what could be in store for investors:

  • What History Tells Us About U.S. Presidential Elections and the Market by Dimensional Fund Advisors:

    • It's natural for investors to look for a connection between who wins the White House and which way stocks will go. But as nearly a century of returns shows, stocks have trended upward across administrations from both parties.

      • Shareholders are investing in companies, not a political party. And companies focus on serving their customers and growing their businesses, regardless of who is in the White House.

      • U.S. presidents may have an impact on market returns, but so do hundreds, if not thousands, of other factors - the actions of foreign leaders, a global pandemic, interest rate changes, rising and falling oil prices, and technological advances, just to name a few.

    • Here's an interactive PDF produced by Dimensional that shows how the market has performed under every president from 1929 to today

  • Indecision 2020: The Potential for a 2000 Election Night Reboot by Matthew J. Bartolini, head of SPDR Americas Research 

    • Bartolini does a deep dive into how a delayed election result might play out


A Few Reminders

  1. Wear a mask.

  2. Wash your hands.

  3. Get some exercise. Every. Day.

  4. Limit your social media intake.

  5. Vote.

Second Quarter 2020 In Review

Summary

The best thing I can say about the first half of 2020 is that it's over. Of course that leaves us with another six months of this crazy year. Let's not think about that right now. Instead, let's focus on what happened during the second quarter.

The first quarter ended with financial markets down and our anxiety levels up. The next two months saw financial markets bounce back aggressively. While I welcome the recovery in the financial markets, the disconnect between the market rally and the grim daily news is unsettling. Uncertainty, which is my contender for Word of the Year, is everywhere.

Second Quarter 2020 Numbers

The average diversified U.S. stock fund, which is a better measure of how we invest than the S&P 500 or the Dow, gained more than 23% during the second quarter. This gain follows a loss of nearly 25% during the first quarter. Investors, justifiably spooked, pulled $28 billion from US stock funds during the second quarter.
 
International stocks also did their best to impersonate a yo-yo: The average diversified international stock fund up 18%, which comes on the heels of a 23% loss during the first quarter. Investors demonstrated less confidence in international stocks funds by pulling nearly $62 billion out of those funds during the quarter.

The average intermediate-term bond fund gained 5.0% during the second quarter, which added to its gain of 0.4% during the first quarter. In a flight to safety, investors plowed nearly $184 billion into bond funds during the second quarter.

Returns By Broad Category

Callan June 2020.jpeg

Can't read this? Here's a link to a PDF of this chart.

The chart above provides a high-level view of how the broad asset categories have fared annually from 2014 - 2019, monthly from January - June 2020 and year-to-date 2020. 

I love this chart and always look forward to seeing the updated version. Two takeaways:

  1. Notice any patterns? If you answered "yes", we need to talk because your brain operates on a different level than mine. It's impossible to consistently predict which categories will perform best from year-to-year or month-to-month.

  2. This chart is Exhibit A for why it's prudent to build diversified portfolios. Sadly, diversification means you're always having to say you're sorry because it's rare for every category to produce positive returns.

What's Next?

You may read or listen to the news.

You may ask yourself, well, how did we get here?

You may ask yourself, why won't some people wear masks?

You may tell yourself, financial markets cannot be this disconnected from reality.

You may tell yourself, our elected officials aren't actually leaders.

Same as it ever was.

Given all of the bad news, and the questions you're probably asking yourself, it's natural - and okay - to be nervous or unable to focus. I've found it helps to exercise daily and do something I enjoy, such as painting.

Since we're surrounded by so much uncertainty this year, I recommend focusing on some positive things:

  1. Using history as a guide, we know that financial markets will recover. The timeline for recovery may be different with every event, but it still happens. Your portfolio will recover, too.

  2. At least we have the internet*. Can you imagine being stuck at home without it during a pandemic? The internet allows many people to be able to work from home, get news, and have access to pretty much every form of entertainment.

  3. We've stopped hearing about murder hornets.

Wear a mask when you go out, wash your hands frequently, and stay healthy!

*Don't get any ideas, 2020!

First Quarter 2020 In Review

Summary

Unless you've been living in a van down by the river, you know that the first quarter of 2020 was...overwhelming.

January started off well: Investors were feeling good about the stellar year that was 2019, financial markets continued to hit all-time highs, and unemployment was low. However, during the early weeks of 2020 it became clear that COVID-19 was turning into a serious global pandemic. Financial markets peaked on or around February 19, and then fell quickly and severely. Since then, investors have experienced swings in financial markets nearly every day, with double-digit rebounds in most stock indices.

As if a global pandemic wasn't enough, the price of oil cratered due to a price war, which only exacerbated the ups and downs in financial markets.

First Quarter 2020 Numbers

The average diversified U.S. stock fund, which is a better measure of how we invest than the S&P 500 or the Dow, lost nearly 25% during the first quarter. Investors, justifiably spooked, pulled $89 billion from US stock funds.
 
Returns for international stocks were also negative, with the average diversified international stock fund down 23%. Surprisingly, investors sent nearly $7 billion into international stocks funds during the quarter.

The average intermediate-term bond fund gained 0.4% during the first quarter. In a flight to safety, investors pulled $160 billion from bonds in favor of cash and gold.

This does not mean you should run out and buy gold. 

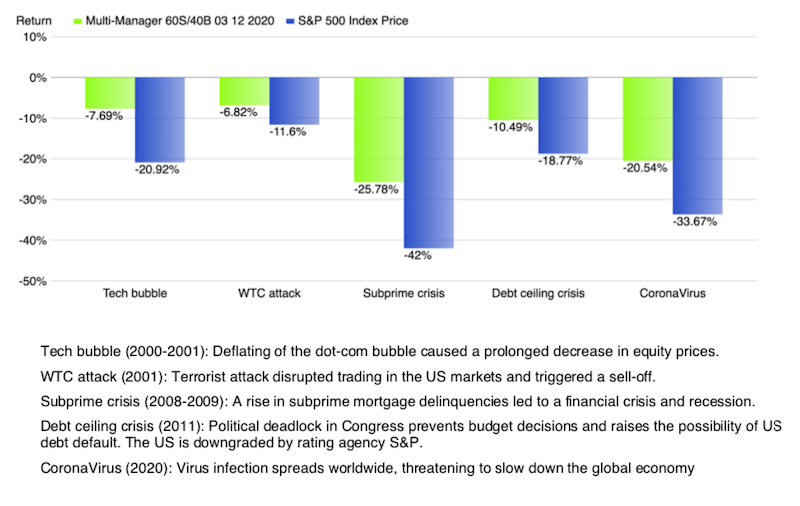
Screen Shot 2020-04-06 at 3.34.29 PM.png

Unmarked Hazards Exist

In mid-January, I was fortunate to go snowboarding in Taos, New Mexico. While on the mountain, I saw signs everywhere reminding boarders and skiers that "unmarked hazards exist". That's because snow and bad weather can hide rocks, holes, and numerous other hazards.

The chart above is a good reminder about unmarked hazards. The chart shows five major hazards that have disrupted financial markets over the last 20 years. The CoronaVirus hazard was recently added, after replacing the Long-Term Capital Management (LTCM) hedge fund bailout of 1998.

In hindsight, it's easy to say that most of the hazards shown above were obvious. After 2001 it was obvious to everyone that tech stocks had been wildly overvalued. After 2009 it was obvious to everyone that the combination of a housing bubble and sub-prime lending had caused a financial crisis.

I suppose one could argue that some hazards are expected. For example, public health officials and other extremely intelligent people, such as Bill Gates, predicted a pandemic would occur and have a severe negative impact on the global economy. However, no one could predict exactly when a pandemic would occur or where it would begin.

Since the financial crisis of 2008-2009 investors have experienced a relatively smooth bull market. During that 10-year period I have sometimes shown the chart of hazards to clients when discussing their financial plan and investment allocation. My goal was twofold: First, to demonstrate how previous events have affected financial markets and client portfolios. Second, to reinforce the idea that another unknown event - not currently on the chart - would negatively affect markets sooner or later. 

In other words, as investors, we have to accept that unmarked hazards exist. Something new, that's nearly impossible to plan or prepare for, will always come along to shake things up. The only thing we can do is create a plan and stick to it when the event finally occurs.

Where Do We Go From Here?

12Monkeys.gif

The movie 12 Monkeys is a great documentary about life in a post-pandemic world.

Uncertainty is always a problem, but it's a major one right now.

Everyone wants to know, among other things: How long will the pandemic last? How many deaths will there be? When can we resume our normal everyday routines? When will financial markets recover?

Unfortunately, no one can answer these questions right now. Given all of the bad news we're seeing every day, it's natural - and okay - to be nervous or unable to focus. I'm finding it difficult to focus when reading books or watching TV.

Since we're surrounded by so much uncertainty in these strange times, I recommend focusing on some positive things:

  1. Using history as a guide, we know that financial markets will recover. The timeline for recovery may be different with every event, but it still happens. Your portfolio will recover, too.

  2. If you are fortunate to be able to work from home during this pandemic, take a moment to think about how wonderful this is. Sure, you're stuck inside and your daily routine has been disrupted, but you are safe and you have income.

  3. If you have children, being stuck inside with them can be challenging. However, this is a great opportunity to spend more time with your loved ones. Play some boardgames, do some puzzles, or watch some movies.

  4. If you're stuck at home this is might be a good opportunity to work on home improvement projects you often don't have time for.

Stay home (if you can), wash your hands frequently, and stay healthy!

Third Quarter 2018 In Review

Stock Market Summary

Looking at broad market indices, the US outperformed non-US developed and emerging markets during the quarter.  

Small caps underperformed large caps in the US, non-US developed, and emerging markets. The value effect was positive in emerging markets but negative in the US and non-US developed markets. 

Real estate (REIT) indices underperformed equity market indices in both the US and non-US developed markets.

US Stocks

The US equity market posted a positive return, outperforming both non-US developed and emerging markets. 

Value underperformed growth in the US across large and small cap stocks.

Small caps underperformed large caps in the US.

International Developed Stocks

In US dollar terms, developed markets outside the US underperformed the US but outperformed emerging markets during the quarter.

Large-cap value stocks underperformed large-cap growth stocks in non-US developed markets; however, small-cap value outperformed small-cap growth.

Small caps underperformed large caps in non-US developed markets.

Emerging Markets Stocks

In US dollar terms, emerging markets posted negative returns for the quarter, underperforming developed markets including the US.   

The value effect was positive, particularly in large-caps in emerging markets. 

Small-caps underperformed large-caps.

Fixed Income

Interest rates increased in the US during the third quarter. The yield on the 5-year Treasury note rose 21 basis points (bps), ending at 2.94%. The yield on the 10-year Treasury note increased 20 bps to 3.05%. The 30-year Treasury bond yield rose 21 bps to 3.19%.

On the short end of the yield curve, the 1-month Treasury bill yield increased 35 bps to 2.12%, while the 1-year Treasury bill yield rose 26 bps to 2.59%. The 2-year Treasury note yield finished at 2.81% after an increase of 29 bps.

In terms of total return, short-term corporate bonds gained 0.71%, while intermediate-term corporates returned 0.80%.

Impact of Diversification

Remember how I'm always reminding you that the rate of return in your portfolio probably won't look like that of the S&P 500 or Dow? Well, I'm going to remind you again.

These portfolios illustrate the performance of different global stock & bond mixes and highlight the benefits of diversification. Mixes with larger allocations to stocks are considered riskier but have higher expected returns over time.

That's all for this week. Next week I'm planning to start a series of posts that explain my approach to investing. Fun!

Second Quarter 2018 In Review

One, Two, Three, Four, I Declare a Trade War

The primary question on investors' minds during the second had to be how far the trade war would go between the U.S. and its trading partners. During most of the quarter, it seemed one could reasonably expect markets to be down one day and then up the next. It got to the point that I often tried to predict the day-to-day headlines of The Wall Street Journal. My idea of fun is probably different from yours.

If the scope of the trade war was the primary question on investors' minds, the second was whether or not the Federal Reserve would raise interest rates. Spoiler: It did - and the Fed indicated there would be two additional rate hikes in 2018.

Let's look at the numbers.

Q2 2018 Numbers

The average diversified U.S. stock fund, which is a better measure of how we invest than the S&P 500 or the Dow, gained 3.7% during the second quarter, which brings the year-to-date return to 3.4%. Investors, still jittery about the long bull market and an escalating trade war with China couldn't get out of stocks fast enough. Nearly $59 billion flowed out of stock funds during the quarter.

International markets didn't fare well: The average diversified international stock fund declined by 2.1% in the second quarter, which brings the year-to-date loss to 2.7%. Investors were more optimistic about foreign stocks because $89 billion flowed into international stock funds during the quarter. Of course, international stocks will be affected by a trade war, so the shift to foreign markets may not help all that much in the long run.

The average intermediate-term bond fund lost 0.3% during the second, which brings the year-to-date loss to 1.7%. A whopping $128 billion flowed into bond funds during the quarter, again over concerns about the long bull market and trade war.

Expectations For The Third Quarter

When it comes to financial markets and investments, I honestly don't know what to expect. No one does. The best I can do is make a few educated guesses:

  1. The U.S. and its trade partners will continue to talk about tariffs, which will lead to retaliatory actions or threats of actions.
  2. Consumers and the global economy will be the casualties of a trade war.
  3. In the event of a trade war, investors should look to small-cap stocks, which are less likely to be vulnerable to trade spats.
  4. Since the Federal Reserve has already tipped its hand, and unless anything unanticipated happens, I believe it's safe to say there will be a rate increase during the third quarter.


As always, you should focus on what you can control. Make a financial plan that's right for your goals and financial situation. And stick to it.

Listening / Reading / Watching

Here's what has my attention right now:

  • The Three-Body Problem by Cixin Liu. Since I was going to spend two weeks in China, I decided to reread this excellent novel by China's most famous science fiction author. Go read it. Now.
  • The Dark Forest by Cixin Liu. And then I promptly started reading book two in the trilogy. Again, go read it. Now.
  • On to book three, Death's End.

First Quarter 2018 In Review

V is for Volatility

Spring has arrived! Unfortunately, volatility is back with a vengeance, too.

It's difficult to believe the U.S. bull market is more than nine (!) years old. Nine years ago my wife and I hadn't even welcomed our second child into the world. 

What's causing the volatility? Worries about inflation, the threat of a trade war with China, privacy concerns related to the mismanagement of consumer data by big tech companies, daily tweets from He-Who-Must-Not-Be-Named, and concerns that the actor playing young Han Solo doesn't really look or sound like everyone's favorite smuggler.

Okay, maybe that last one's a stretch. Let's look at the numbers.

Q1 2018 Numbers

Remember all the way back in 2017 when financial markets were posting strong returns? Sadly, that hasn't carried over into 2018. The most commonly used benchmark, the S&P 500 Index, posted a decline of 1.17%.

The average diversified U.S. stock fund, which is a better measure of how we invest than the S&P 500 by itself, lost 0.4%. Investors, wary of, among other things, a long bull market and a potential trade war with China, are exercising caution, with nearly $53 billion flowing out of stock funds during the quarter.

Losses weren't confined to domestic markets: The average diversified international stock fund declined by 0.6% in the first quarter. In a sign of investors' preference for foreign markets, $80 billion flowed into international stock funds during the quarter.

The average intermediate-term bond fund lost 1.4% during the first quarter. Nearly $75 billion flowed into bond funds during the quarter, likely due to concerns about volatility in stocks.

Expectations For The Second Quarter And Beyond

When it comes to financial markets and investments, I honestly don't know what to expect. I can make educated guesses, but anyone who tells you they know what is going to happen tomorrow, next month, or next year is lying.

The markets have come a long way since March of 2009, which has been wonderful for investors. I know there will be a correction at some point, but I cannot predict when it will happen or what will cause it.

In the meantime, you should focus on what you can control. Make a financial plan that's right for your goals and financial situation. And stick to it.

Listening / Reading / Watching

Here's what has my attention right now:

  • The Gone World by Tom Sweterlitsch. What if the United States managed to reverse engineer extremely advanced technology? And then started exploring the galaxy? And also mastered time travel? This book manages to answer all of those questions while keeping the focus on a murder investigation. Did I mention there are also alternate universes? It's great fun and I highly recommend it.
  • The Stone Sky by N.K. Jemisin. I don't even know how to describe this without spoiling anything. This is book three in a series called The Broken Earth. And you should read it. I'm sure you're thinking, "Great, another trilogy". Trust me, it's worth it. Jemisin is an amazing storyteller.

Fourth Quarter and Full-Year 2017 In Review

Goodbye, 2017!

Every year seems to pass more quickly than the one before it. 2017 was no exception. Let's take a look at what happened in the financial markets.

Q4 and Full-Year 2017 Numbers

The most commonly used benchmark, the S&P 500 Index, had another strong quarter, up 6.64%, which means the S&P 500 ended up 21.83% for the year. Not bad.

The average diversified U.S. stock fund, which is a better measure of how we invest than the S&P 500 by itself, gained 6.0% during Q4, putting domestic stock funds up 18.3% for the year. Investors, still wary of high valuations in U.S. stocks and a long bull market, are exercising caution, with $38 billion flowing out of stock funds during 2017.

The average diversified international stock fund gained 4.9% in the fourth quarter. This gain put international stock funds up 26.8% for the year. In a sign of investors' preference for foreign markets over domestic, $233 billion flowed into international stock funds during the year.

The average intermediate-term bond fund returned 0.4% during the fourth quarter, which put them up 3.6% for 2017. A whopping $379 billion flowed into bond funds during the year, likely due to concerns about the valuations of U.S. stocks.

Managing Expectations

The financial crisis may not have reached rock bottom until March of 2009, but it kicked into high gear in September of 2008. That means later this year it will have been ten years since the start of the crisis. We've experienced great returns since then. Well, I hate to be "that guy", but I'm going to remind you that markets don't always go up.

Those of you who read or watch Game of Thrones are familiar with the phrase "Winter is coming". For the non-nerds here this basically means one should always be prepared because the good times, or in this case, good returns, won't last forever.  Fortunately, we're only talking about investment returns, not White Walkers marching south with an army of the dead. And an undead dragon.

I wish I could tell you exactly when a correction will occur. I can't, but I'm bound to be right eventually. In the meantime, we can be thankful for years like 2017. In addition, we can "prepare for winter" by rebalancing our portfolios, maintaining a sufficient emergency fund, and sticking to our financial plans.

New Year's Goals

Goals, resolutions, or plans. I don't care what you call them; I think it's good to kick off the year with a few ways to challenge yourself. Here are my goals for 2018:

  1. I will draw and paint again. In fact, I just relaunched my videogame-themed art website, www.8bitart.com, where I'll post regular updates on my work.
  2. I will continue my Crossfit and yoga regimen. I started this routine in September of 2017 and I feel great. Bonus: No more back pain.
  3. I will pay less attention to social media sites like Facebook and Twitter. Social media is a vampire that sucks your time instead of your blood. I think we'd all be better off spending less time on those sites. Read a book. Play a board game. Paint a picture.

I hope you set some goals for yourself!

Third Quarter 2017 In Review

Heading Into the Homestretch

Fall is finally here, which means it's time for many of my favorite things: Cool weather in D.C., fall apples, Oktoberfest beers, Halloween, and scary movies.

Speaking of scary, October is usually thought of as a scary month for the stock market, but September actually has more historical down days in the markets. The good news is that I have nothing scary to report for September - or the third quarter.

Q3 2017 Numbers

The most commonly used benchmark, the S&P 500 Index, had another strong quarter, up 4.48%. That puts the S&P 500 up 14.24% through September 30th.

The average diversified U.S. stock fund, which is a better measure of how we invest than the S&P 500 by itself, gained 4.2%, which puts domestic stock funds up 12.3% through September 30th. Investors, still wary of high valuations in U.S. stocks and a long bull market, are exercising caution, with nearly $48 billion flowing out of stock funds during the quarter.

The average diversified international stock fund gained 5.9% in the third quarter. This gain puts international stock funds up an impressive 21.9% for the year. Emerging market funds are performing even better, up 26.5% so far. In a sign of investors' confidence in foreign markets, $48 billion flowed into international stock funds during the quarter.

The average intermediate-term bond fund returned 0.8% during the second quarter, which puts them up 3.2% from January 1st through September 30th. A whopping $95 billion flowed into bond funds during the quarter, likely due to concerns about the valuations of U.S. stocks.

Expectations for the Fourth Quarter

The President and Congress, having failed at two attempts to repeal and replace the Affordable Care Act, have moved on to tax reform. I assume we'll see more details about proposed changes to the tax code, but I'm not holding my breath.

When it comes to financial markets and investments, I honestly don't know what to expect. The markets have come a long way since March of 2009, which has been wonderful for investors. I know there will be a correction at some point, but I cannot predict when it will happen or what will cause it.

As we head into November - and prepare to celebrate Thanksgiving - let's be thankful for how our investments have performed over the past eight years. And let's also prepare mentally for things to change, because we know they will eventually.

Listening / Reading / Watching

Here's what has my attention right now:

Second Quarter 2017 In Review

Past the Halfway Point

It's another hot and humid summer in D.C. If you're in the D.C. region I hope you have plans to get away to a cooler climate (or just somewhere fun).

Here's a four-point summary of what happened during the second quarter:

  1. U.S. stocks continued to perform well, with health and biotech stocks leading the way.
  2. Bond funds were also in positive during the second quarter.
  3. Investors in foreign stocks were rewarded for their patience as international investments performed even better than domestic stocks.
  4. In June, the Federal Reserve raised the target Federal funds rate by 0.25%.

Q2 2017 Numbers

The benchmark S&P 500 gained 2.6% during the second quarter, which puts it up 8.2% for the first half of the year.

The average diversified U.S. stock fund, which is a better measure of how we actually invest, gained 2.7%, just slightly higher than the market. This puts domestic stock funds up 7.7% through the first half of 2017. Investors, perhaps wary of high valuations in U.S. stocks, are exercising caution, with $23 billion flowing out of stock funds.

The average diversified international stock fund gained 6.5% in the first quarter. This gain puts international stock funds up 15% for the year. In a sign of investors' confidence in foreign markets, $78 billion flowed into international stock funds during the quarter.

The average intermediate-term bond fund returned 1.4% during the second quarter and 2.4% for the first half. $93 billion flowed into bond funds during the quarter, likely because investors are worried about the valuations of U.S. stocks.

Expectations for the Third Quarter

Legislation coming out of D.C. may affect markets during the third and fourth quarters of 2017. This includes, but is not limited to, health care overhaul, infrastructure spending, and tax reform. Or our elected officials will continue to behave like children and nothing will be accomplished. My money is on the latter option.

Listening / Reading / Watching

Here's what has my attention right now:

  • Game of Thrones on HBO. Because winter is coming, of course.
  • I need recommendations for fun summer books! Have any good mindless page-turners? Let me know.