Navigating Market Volatility: Understanding the Impact of Tariffs and Trade Policy. This article examines the recent surge in trade tensions, exploring the historical context of tariffs, their impact on the US economy, the dollar, and inflation. Learn how investors can maintain perspective and focus on long-term goals amidst market fluctuations driven by trade policy headlines
Market Perspectives After a Nervous Start to 2025
The stock market has struggled in recent weeks as concerns have grown around interest rates, market valuations, the direction of the economy, and more. Since the market peak on December 6 last year, the S&P 500 has pulled back 4.3% while the 10-year Treasury yield has climbed from 4.15% to 4.76%.
This market decline reflects a natural adjustment as investors digest new economic data. The recent jobs report for December was stronger than expected, which means the economy may need less support from the Fed in the form of lower interest rates. At the moment, the market believes the Fed will cut rates just once in 2025, and that this may be the final cut of the cycle. However, these expectations can shift quickly, as they did throughout 2024.
Market volatility is normal and expected after two strong years
This chart shows total returns of the stock market (bars) and the largest intra-year decline (dots) each year. The average year sees a significant intra-year drop. However, most years still end in positive territory, especially with dividends.
This is where setting the right expectations is necessary. While market declines can be unsettling, it’s important to remember that there have only been a handful of trading days this year and a lot can happen in the coming months. Markets also began last year with a brief pullback that then gave way to a long rally. While the past is no guarantee of the future, long-term investors should not overreact to a few days of market uncertainty. If anything, this beginning-of-year volatility may present opportunities to review and rebalance portfolios according to long-term financial goals.
It’s important to keep in mind that markets have been relatively calm over the past two years as major indices have climbed to new record highs. As the accompanying chart shows, last year’s largest decline for the S&P 500 was only 8%, which is low by historical standards.
History shows that almost every year experiences several market pullbacks. Markets tend to recover quickly from these short-term declines, so trying to time them often backfires. This is why, for investors with longer time horizons, it’s often better to simply stay invested. Investors who stayed in the market over the past several years, despite the pandemic, inflation, Fed rate hikes, geopolitical conflicts, and other issues, have come out ahead
The Magnificent 7 have contributed meaningfully to market returns over the last three years. However, the Magnificent 7 have also been much more volatile. During the initial market pullback in 2022, the Magnificent 7 lost nearly half of their value. As such, volatile technology stocks play an important role in diversified portfolios, but are risky as standalone investments.
The Magnificent 7 have propelled U.S. stocks to new heights
Another concern among investors is whether the rally in technology and artificial intelligence stocks is sustainable. Investors often focus on the so-called “Magnificent 7” – seven technology stocks that have benefited from trends in AI. They have been at the heart of the broad market’s strong performance: as a group, these stocks have soared 250% since the beginning of 2023, and nearly 500% since 2020.
Despite the Magnificent 7’s rally and the ongoing importance of AI, investors should maintain a broader perspective. In 2022, during a period of rising rates and economic stress, technology and growth stocks were the hardest hit. This is because the value of these stocks depends greatly on expected earnings and cash flows far into the future. So, when interest rates go up, the value of these future cash flows can decline, leading to a setback in stock prices.
Another risk for investors is that, because the S&P 500 is weighted by the size of companies, stocks like Nvidia that outperform can become overweighted in investment portfolios. Investors may find that they are less diversified than they would like, or that their portfolios are far more sensitive to the movements of just a few stocks.
This is not a statement of whether the Magnificent 7 will or won’t continue to perform well. Instead, it’s a reminder that investing is not about making a few concentrated bets; it’s about constructing an appropriate portfolio that is aligned with long-term financial goals, ideally with the guidance of a trusted advisor.
Valuations are historically high
This PE ratio uses next-twelve-month earnings estimates, so it is forward rather than backward-looking. Valuations are no longer as attractive due to the market rally of the past year. Investors should properly diversify across asset classes, both in the U.S. and globally.
Perhaps the most significant difference investors face this year is that stock market valuations are well above average. As the accompanying chart shows, the price-to-earnings ratio for the S&P 500 is 21.5x, near its highest level in recent years and not far from the all-time peak of 24.5x during the dot-com bubble. In fact, some investors wonder if there is a market bubble today, or at least one in AI stocks.
A high price-to-earnings ratio means that investors are paying more for every dollar of earnings than in the past. This means that future returns may be lower, or equivalently, that markets have gotten ahead of future returns. The key question is whether the underlying economic and market fundamentals are healthy, or if the market rally is built on a house of cards as it was in 2000 or 2008. Today, the economy is still growing steadily, the job market is strong, and the companies with the most enthusiasm have robust earnings.
When valuations are high, the solution is not to avoid stocks altogether. Instead, it’s to stay balanced across different parts of the market that can outperform at different times. These might include sectors beyond Information Technology and Communication Services, and also investment styles such as value, small caps, or other uncorrelated opportunities. The key is to hold a portfolio that is appropriate for your specific financial goals.
The bottom line? While the stock market has struggled in recent weeks, investors should not overreact. Instead, it’s important to maintain a balanced portfolio that can withstand short-term uncertainty, while supporting long-term financial goals.
The Outcome of the 2024 Presidential Election and Investing
After a historic campaign, Donald Trump has won the 2024 presidential election and Republicans have won control of the Senate. For half the country, this is a cause for celebration, while for the other half, this is a disappointing result that will require time to process. This reflects the divisions in our country on both social and economic matters that we hope will heal in time.
The stock market has performed well across both parties
It’s clear that political outcomes can influence our daily lives and the direction of the country. However, regardless of which side of the aisle you’re on, history shows that the impact of politics on portfolios is often overstated. It’s important in the coming weeks to not overreact in either direction, but to instead keep a level head. Putting politics aside, what might this result mean for the economy and financial markets over the next four years?
From a broad perspective, history shows that the stock market and economy have performed well under both parties over the past century. In the coming weeks, there will likely be both bullish and bearish predictions. Some may expect a significant rally similar to the 2016 election, while others will expect issues like tariffs to slow the global economy.
When it comes down to it, long-term investors should continue to walk the line by staying invested, diversified, and focused on fundamentals. On the one hand, stock market valuations are already well above average, making it more important to be thoughtful when building portfolios, ideally with the guidance of a trusted advisor.
On the other hand, investors should also be wary of overly pessimistic views on the market. It's likely that predictions for market crashes have been made about every president in modern times. In recent years, it was certainly said about Obama in 2008, Trump in 2016, and Biden in 2020. Thus, it's important to separate personal and political feelings from financial plans and investments.
This is not to say that good policies don’t matter, but instead that business cycles are driven by factors beyond politics. What’s more, policy changes tend to be incremental, even when a President’s party controls Congress. History also shows that it is very difficult to predict how any particular policy might affect the economy and markets since stock prices adjust to new policies and companies adapt quickly as well.
The Tax Cuts and Jobs Act will likely be extended
Regarding taxes, a Republican Party victory makes it likely that much of the Tax Cuts and Jobs Act will be extended beyond its 2025 expiration. The TCJA overhauled the tax code for both individuals and businesses, including cutting corporate taxes to 21%, reducing many individual rates across tax brackets, lowering income taxes for many Americans, doubling the estate tax exemption, and more.
In addition, the uncertainty over these provisions during the election season made tax planning more complex. The expiration of the TCJA would create a potential “tax cliff” for many individuals and businesses. As a result, Roth IRA conversions, for instance, reportedly increased leading up to the election as individuals took advantage of current low tax rates.
It’s important to maintain perspective around tax policy since these issues can be politically charged. While taxes have a direct impact on households and companies, they do not always have a straightforward effect on the overall economy and stock market. This is because taxes are only one of the factors that influence growth and returns, and there are many deductions, credits, and strategies that can reduce the statutory tax rate.
The market has performed well across many tax regimes across history, including periods when the highest marginal rates were between 70% and 94% after World War II. Taxes today are low by historical standards. As the national debt grows, it’s prudent for investors to expect tax rates to eventually rise. Planning for this possibility is only growing in importance.
Tariffs and trade wars are back in focus
Looking at proposed policies, many investors worry that a second trade war could result from tariffs on major trading partners including China, the European Union, Mexico, and Canada. During his first term, President Trump increased duties on many goods including steel, aluminum, solar cells, washing machines, and more. On the campaign trail earlier this year, he proposed raising tariffs further, including up to 60% on China.
Unlike tax policy, which requires congressional approval, the president can impose tariffs through executive order. While many worry that this could harm the economy, analyzing tariffs can be complex. The Trump administration’s use of tariffs in 2018 and 2019 was often as a negotiating tactic, leading to a “Phase One” trade deal with China in early 2020. While the merits of the deal can be debated, the worst-case predictions for the economy and market never occurred.
In theory, tariffs can be inflationary since they increase the final costs of goods for consumers. Additionally, they run counter to long-held economic views that open trade creates mutual benefits for trading partners. However, they can also help to protect domestic industries from unfair trade practices, as well as secure intellectual property from theft and forced transfers.
The reality is that many tariffs imposed by the Trump administration were continued under President Biden. The current tariff proposals reflect the trends of de-globalization and protectionism that have emerged over the past decade. Once again, while tariffs and trade wars may impact certain industries and businesses, it’s important to not overreact with our portfolios.
Investors should focus on years and decades, not days and weeks
With the election now over, investors will shift their focus back to other economic considerations such as the Federal Reserve’s next rate decision, corporate earnings, and consumer spending. The fact that a significant source of uncertainty has been lifted could be enough to improve investor sentiment, as it has in past election seasons.
Ultimately, the business cycle is what has driven long run returns over the past century, and not two or four-year election cycles. These long-term business cycles are the result of broader factors such as industrialization, globalization, the information technology revolution, trends in artificial intelligence, and more. For investors with financial plans spanning years and decades, focusing on these longer-run trends is far more important than reacting to daily headlines.
The bottom line? Regardless of political views, investors should stay invested and diversified as the election season comes to a close. Clarity around taxes, tariffs, and other policies will help, but maintaining perspective around long-term trends is still the best way to achieve financial goals.
Perspective on the Fed and Market Sell-Off
To paraphrase Ernest Hemingway, shifts in the stock market often occur “gradually, then suddenly.” Over the past month, the market has rotated from large cap technology stocks to small caps and other sectors. Following the latest jobs report, however, global stocks experienced a sharp pullback due to concerns over the timing of Fed rate cuts, a weakening labor market, and disappointing tech earnings. Financial markets are on edge as investors adjust to a changing economic landscape.
Specifically, the Nasdaq is now in correction territory, defined as a 10% decline from recent highs. The S&P 500 has pulled back 5.7% from its high three weeks earlier, while the Dow has been steadier with a decline of 3.5%. The VIX, often described as the market’s “fear gauge,” has surged to its highest level since early 2023. The 10-year Treasury yield has now fallen below 3.8%, a sharp decline from 4.7% only three months ago.
Ironically, current macroeconomic conditions – inflation returning to 2%, low but rising unemployment, falling interest rates, and double-digit stock market gains – are exactly what investors had hoped for at the start of the year. Now more than ever, investors need perspective to navigate markets and stay on track to achieve their financial goals. How should investors view recent stock market swings as they position for the coming months?
Investors need perspective in volatile markets
Investors focused on recent performance alone would no doubt wonder if the cycle is over. While recent market events are still playing out, it’s important to remember that not only are stock market swings normal, but they can also be healthy if they are the result of investors adjusting to new economic facts. This is especially true if valuations improve as prices adjust and corporate earnings continue to grow.
For many investors, the volatility since 2020 may already seem like a distant memory after the steady recovery of the past year and a half. As the accompanying chart shows, the S&P 500 has gained 113% over the past five years, including the pandemic collapse and the 2022 bear market. While market pullbacks are never pleasant, viewing the market on these timescales does help to put the current decline in perspective.
It's no secret that technology-related stocks, particularly those related to artificial intelligence, have contributed greatly to these market returns. The Magnificent Seven, a group of stocks including Nvidia that benefits from recent trends, is still up a whopping 162% since the beginning of 2023, and has gained 362% since early 2020.
The rotation and now pullback in these stocks is the result of investor concerns over the magnitude of the rally and large tech company earnings. Whether AI and large language models can live up to their lofty promises has yet to be seen, and it’s not surprising that investors are growing antsy at seeing a return on the billions invested by large companies in these technologies.
So far, market fundamentals still appear to be strong regardless of how stocks move in the short run. Profit forecasts are still positive, with S&P 500 earnings expected to grow 13% over the next 12 months. More than half of S&P 500 sectors are expected to grow earnings by double digits, and all 11 sectors are forecasted to experience positive growth. In the long run, earnings are what drive stock market returns, and thus the health of the economy matters more than short-term stock and sector-specific trading activity.
Concerns are growing that the Fed has made a policy mistake
This is why concerns around the Fed have spooked the market in recent days. The Fed has now kept rates unchanged for over a year as it seeks “greater confidence” that inflation is returning to its 2% target. However, its focus on inflation is now resulting in a weakening labor market, which some fear could spiral toward a “hard landing.”
It’s important to remember how fickle market expectations have been. The year began with investors believing the Fed would need to cut rates several times due to an imminent recession. Expectations then shifted after a few hotter-than-expected inflation reports, with investors believing the Fed would not cut at all this year. Today, markets expect the Fed to cut in September and possibly at each subsequent meeting. These swings show how difficult it is to get monetary policy right, even as backseat drivers.
These dynamics have shifted the Fed’s focus to the labor market, with the Fed acknowledging that it is “attentive to the risks to both sides of its dual mandate.” The latest jobs report showed that the economy added 114,000 new jobs in July, lower than the consensus estimate of 175,000. Unemployment, which was expected to remain at 4.1%, rose to 4.3%. While this is still relatively low compared to history, it is the highest rate of unemployment we’ve seen since the pandemic (and mid-2017 before that).
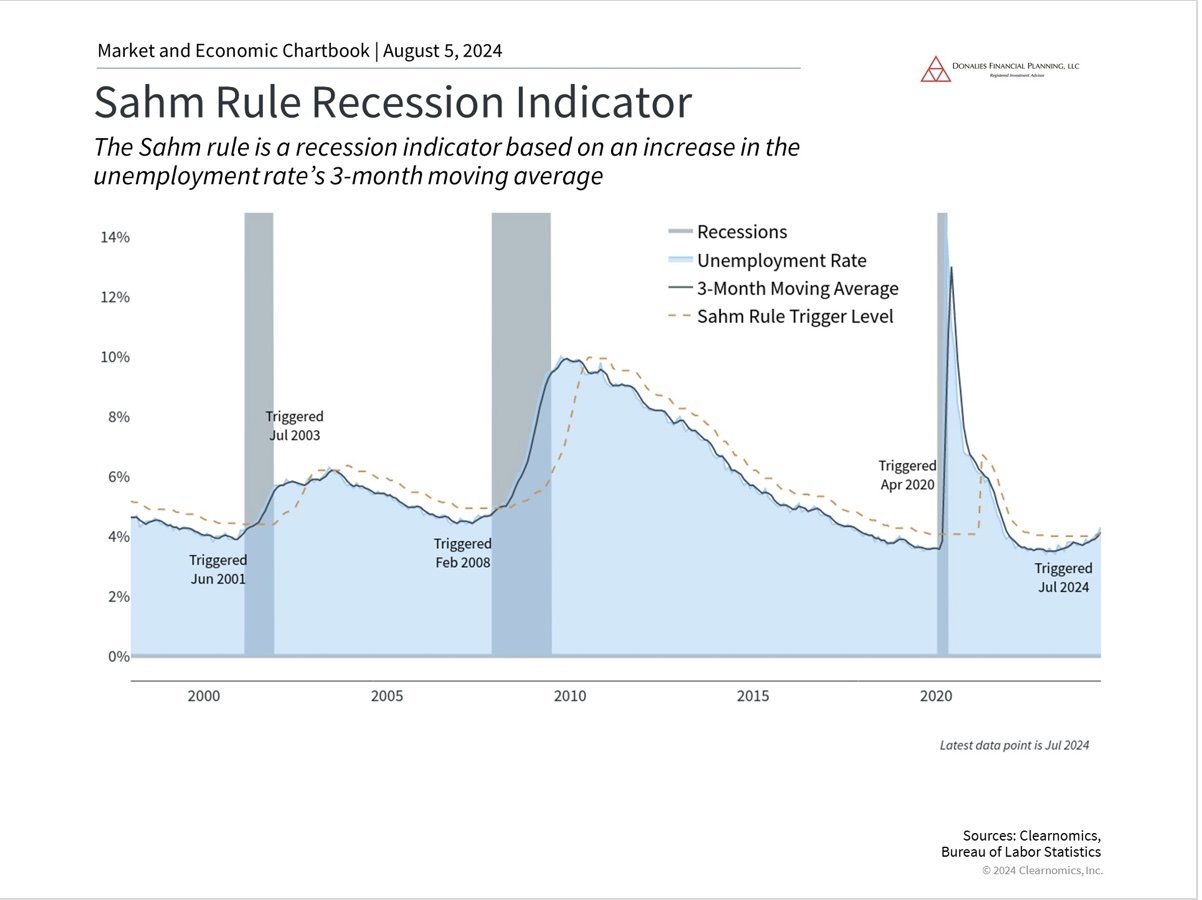
One reason economists are concerned about this increase in unemployment is an economic indicator known as the Sahm rule, shown in the accompanying chart. The Sahm rule, named after a former Fed economist, predicts the onset of recessions based on the trend in unemployment. The simple intuition is that a sudden jump in the unemployment rate is highly correlated with economic downturns. In fact, the very definition of a recession depends on the state of the job market.
The jobs report for July has officially triggered the Sahm rule, suggesting that the current unemployment rate is consistent with the historical pattern of recessions. However, it’s important to keep in mind that immigration and higher labor force participation, both positive factors, were key drivers in rising unemployment. Additionally, Sahm herself has stated that this is more of a “historical regularity” and not a hard-and-fast physical law. In other words, with unemployment still near historic lows, a rise in unemployment to 4.3% should be watched carefully but does not necessarily mean a recession is imminent.
Regardless, both sides of the Fed’s mandate – maximum employment and stable prices – now point strongly to a September rate cut. Investors are now worried that the Fed has waited too long to cut rates.
Whether this is the case has yet to be seen. There have been several historical instances that could be called “soft landings.” Perhaps the most notable occurred from 1994 to 1995 under Fed chair Alan Greenspan when the Fed doubled the federal funds rate from 3% to 6%. Inflation remained under control and the economy continued to grow, avoiding a recession.
Despite the positive outcome, this was a harrowing time for investors since it resulted in the worst bear market for bonds up to that point. However, it’s clear that the outcome was positive in the long run, since it set up the conditions for stocks and bonds to continue their long bull runs.
Historical hard landings, on the other hand, have often been the result of policy missteps rather than just sub-optimal timing. The Great Depression, for instance, was worsened by the Fed’s decision to tighten monetary policy at a time when expansion was needed. Similarly, the high inflation of the 1970s can be attributed to the Fed's overly accommodative stance when prices were rising rapidly. In both instances, the Fed’s actions were essentially the opposite of what economic conditions required, underscoring how severe policy mistakes can be.
Where does the Fed stand today? Very few argue that the Fed has made the wrong moves per se – just that they have not timed them well. While many may wish the Fed had cut rates at its last meeting, it is likely they will do so soon.
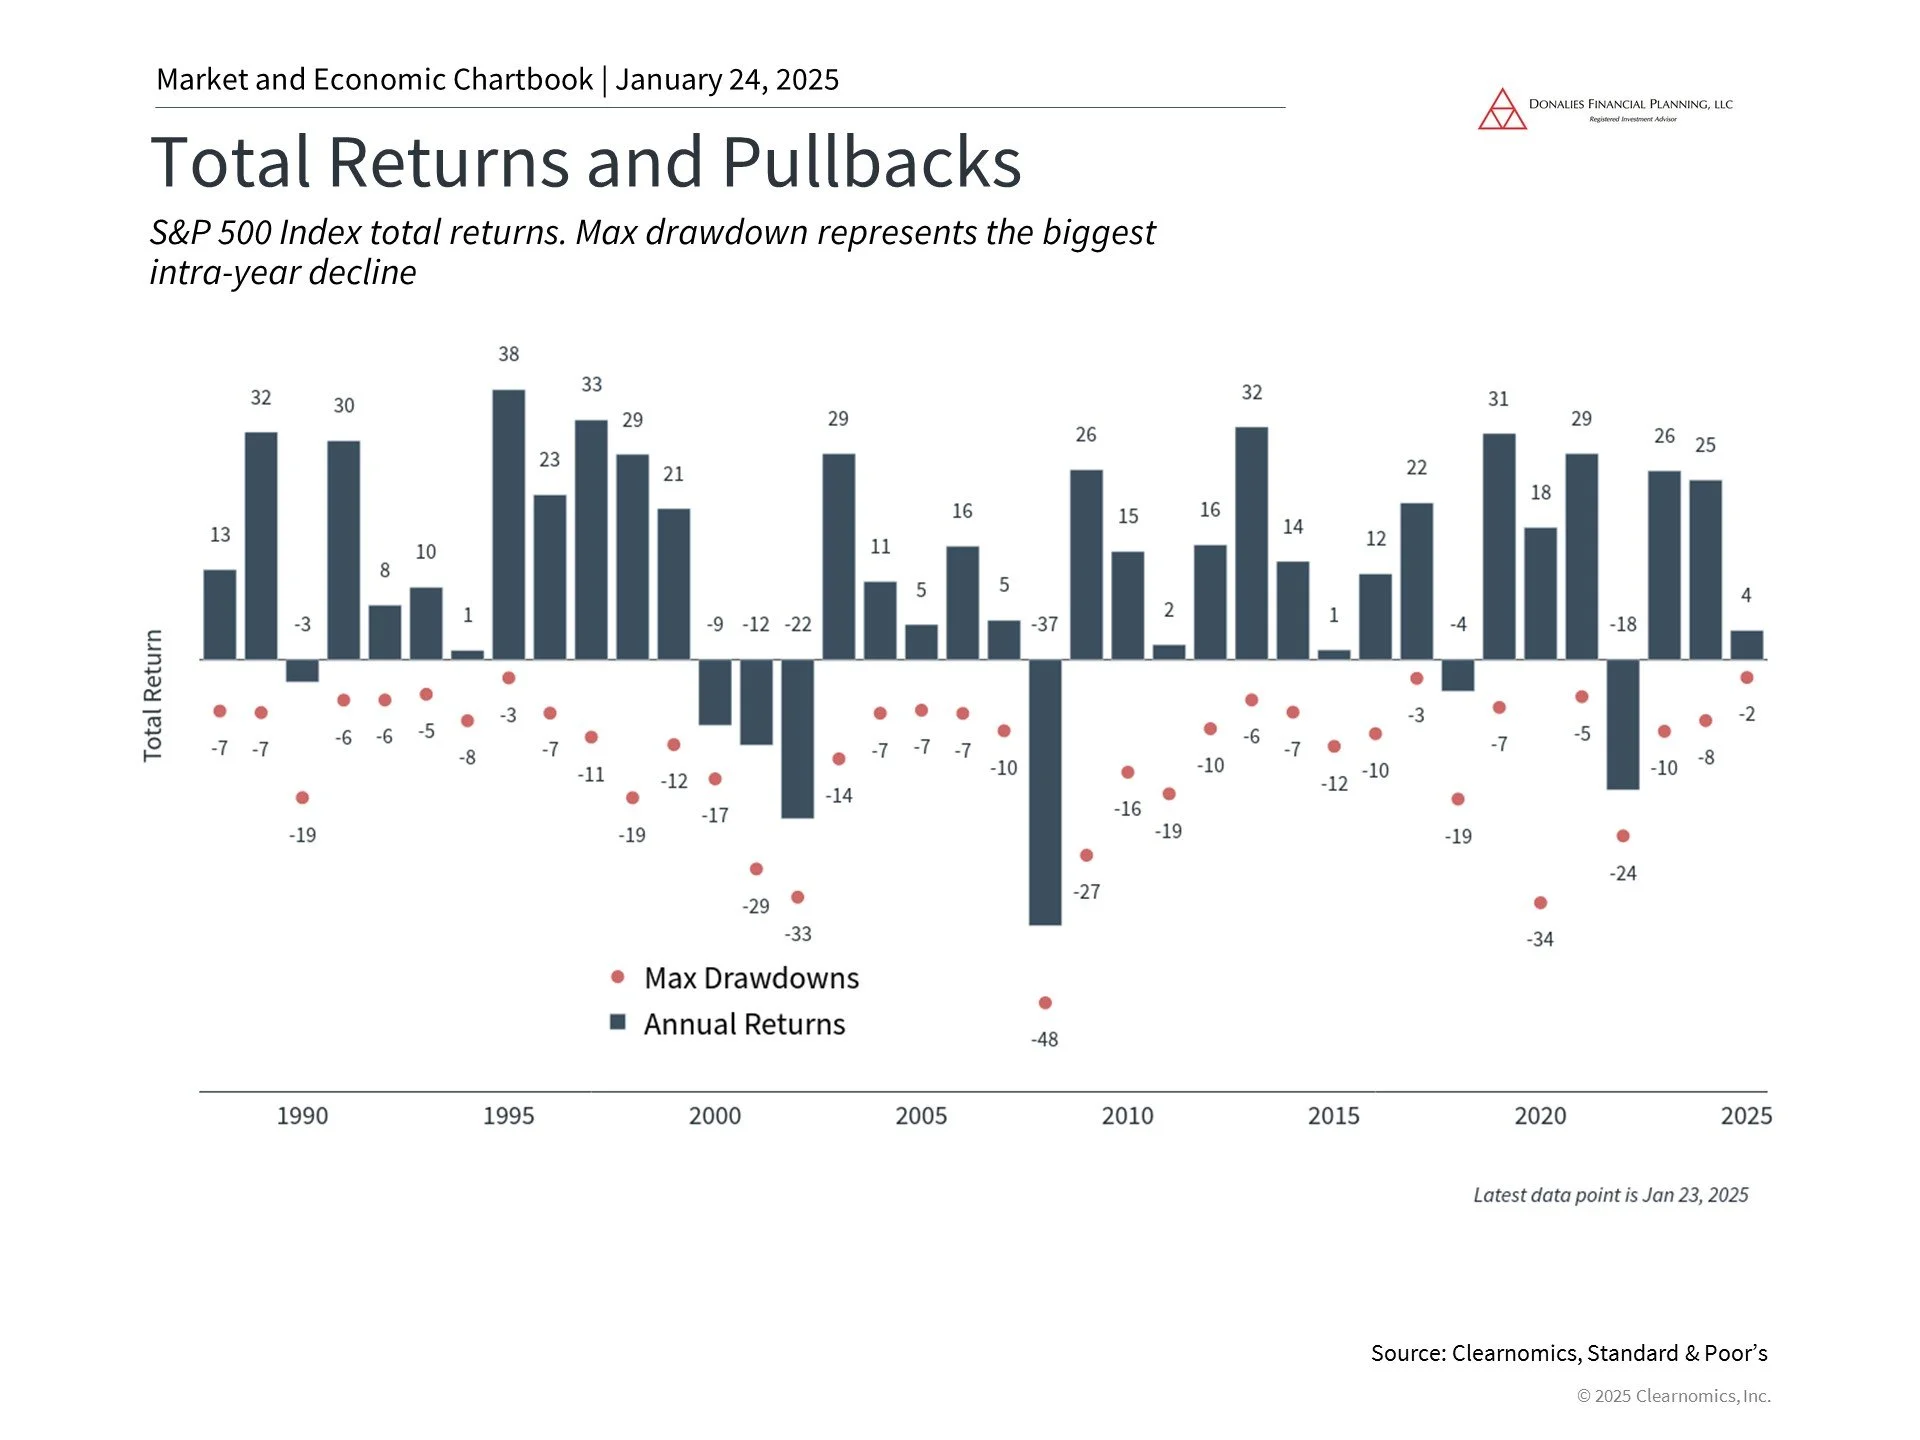
Investing is about both returns and managing risk
Investing is never a sure thing. In the classic book “A Random Walk Down Wall Street,” author Burton Malkiel writes that “the stock market is like a gambling casino where the odds are rigged in favor of the players.” Investing in the stock market comes with many risks that can be managed with proper portfolio construction and a long time horizon. History shows that despite the ups and downs of the market, staying invested is still the best way to grow wealth and achieve financial goals over the course of decades.
Stocks never move up in a straight line, so how we react to market volatility is perhaps more important than the volatility itself. The S&P 500 has now experienced its second 5% or worse pullback this year. As the accompanying chart shows, this is below the average of 4 to 5 pullbacks experienced in the average year, and the dozens during bear markets.
Additionally, current market concerns driven by tech stocks, the Fed, and the labor market all have their silver linings. The economy is still quite healthy, corporate earnings are still growing, and if interest rates do sustainably fall, many other parts of the market could benefit. As in past episodes of volatility, seeing past the current market moves and headlines is needed to benefit from the long-term trend.
The bottom line? Recent economic data have sparked concerns that the Fed should have cut rates sooner. Tech stocks have also declined as investors worry about valuations and earnings. In volatile markets, it’s important for investors to stay level-headed as they work toward their long-term goals.
3 Market Insights for Investors in Q2 2024
2024 began with debates over a “soft” versus “hard” landing as the Fed attempted to stabilize the economy as well as over the sustainability of last year’s market rally. Only three months later, those concerns have given way to a calmer environment centered around fading inflation and the Fed’s plans for reducing interest rates. This has resulted in a strong market rally with the S&P 500 index, Dow Jones Industrial Average, and Nasdaq gaining 10.2%, 5.6%, and 9.1% year-to-date, respectively.
The economic environment has surprised many investors as inflation continues to fade. The Fed’s preferred measure of inflation, the Personal Consumption Expenditures index, rose 2.5% on a year-over-year basis for all prices and 2.8% when excluding food and energy, both significant improvements from their peaks only a year and a half ago. While some areas of inflation such as shelter and energy costs remain problematic, inflation is steadily moving back to the Fed’s long-term 2% target.
Meanwhile, unemployment is still under 4% despite layoffs in the tech sector, interest rates have been more stable with the 10-year Treasury yield around 4.2%, and stock market returns have broadened beyond artificial intelligence stocks. Despite these positive trends, some investors are concerned about the upcoming presidential election and the next phase of Fed policy. These worries are only amplified by the fact that the market is hovering near all-time highs.
In uncertain market environments, it’s more important than ever for investors to maintain a long-term perspective. Below are three key insights for understanding upcoming events and how they have historically affected investors.
1. Steady economic growth has driven markets to new all-time highs.
Click here for a PDF of this image.
The S&P 500 has achieved 20 new all-time highs so far this year despite the brief market pullback during the first two weeks of the year. While this is positive for investors, it is easy to worry that continued market growth may not be sustainable. Do new all-time highs mean that the market is due for a pullback?
While price swings are an unavoidable part of investing, and the market does experience pullbacks from time to time, history shows that markets also tend to rise over long periods. During a bull market cycle, major stock market indices will naturally spend a significant amount of time near record levels, as shown in the accompanying chart. For instance, 2021 experienced 70 days with the market closing at new all-time highs, adding to the hundreds that were achieved since 2013.
Taking a long-term perspective allows investors to benefit from these market trends without constantly worrying about when a pullback might occur. Holding an appropriately diversified portfolio can help investors to withstand market pullbacks without focusing too much on the exact level of the market.
2. Markets have rallied through both Democratic and Republican presidencies.
Click here for a PDF of this image.
Coverage of the presidential election is heating up ahead of the November rematch between Presidents Biden and Trump. While elections are an important way for Americans to help shape the direction of the country as citizens, voters and taxpayers, it’s important to vote at the ballot box and not with investment portfolios.
This is because history shows that markets can perform well under both Democrats and Republicans. As the accompanying chart shows, the economy and stock market have grown over decades regardless of who was in the White House. What mattered more across these periods were the ups and downs of the business cycle. The Clinton years, for instance, benefited greatly from the long expansion of the 1990s. The George W. Bush years, on the other hand, overlapped with both the dot-com crash and the 2008 global financial crisis. Business and market cycles defined their presidencies, and not the other way around.
Of course, politics can impact taxes, trade, industrial activity, regulations, and more. However, not only do these policy changes tend to be incremental, but also the exact timing and effects are often overestimated. Thus, it’s important to focus less on day-to-day election poll results and more on the long-term economic and market trends. Ideally, investors concerned about the impact of specific policies on their financial plans should speak with a trusted financial advisor.
3. The Fed is expected to cut rates as inflation stabilizes.
Click here for a PDF of this image.
The market rally broadened beyond mega-cap technology stocks in the first quarter. The equal weight S&P 500, an alternative to the standard market cap-weighted index, hit a new all-time high in early March, a sign that a wider range of stocks is performing well. The positive economic outlook and the possibility of rate cuts have boosted optimism across many parts of the market.
Given this backdrop, the Fed is expected to cut rates later this year although the timing remains uncertain. The accompanying chart shows the possible path of the federal funds rate based on the Fed’s latest projections, including three cuts this year. At its last meeting, the Fed cited strong job gains and low unemployment as indicators of solid economic activity but emphasized that “the Committee does not expect it will be appropriate to reduce [interest rates] until it has gained greater confidence that inflation is moving sustainably toward 2 percent.”
Regardless of the exact timing and path of Fed rate cuts, these projections represent a reversal of the emergency monetary policy actions that began in early 2022. For investors, it’s important to adapt to this changing environment and not focus solely on the events of the past few years.
The bottom line? With markets near all-time highs, a presidential election approaching, and Fed rate cuts expected to begin later this year, investors should stick to their financial plans while staying invested in the second quarter of the year. History shows that this is still the best way to achieve long-term financial goals.
Second Quarter 2023 In Review
Summary
The rally in the financial markets, which started in the first quarter, continued through the second quarter. The S&P 500 Index gained over 8%, the Dow rose over 3%, and the Nasdaq was up 15%. As of June 30th, these indices are up 15.9%, 3.8%, and 31.7%, respectively.
What's interesting is how much of the rally can be attributed to just seven mega-cap tech companies (Alphabet, Amazon, Apple, Meta, Microsoft, Nvidia, and Tesla):
Can't read this? Here's a link to a PDF of this chart.
As of June 1, the S&P 500 was up 11%. The seven companies referenced above, which I'll call the S&P 7, were up a whopping 53%. When you strip out the S&P 7, the remaining S&P 493 was flat over that period.
The outperformance of the S&P 7 is amazing but not completely unexpected. Most of the tech companies saw steep declines in 2022, so there was a good chance they would bounce back. Add an A.I.-fueled frenzy and the timing was right for a significant rally in tech stocks.
Second Quarter 2023 Numbers
The average diversified U.S. stock fund, which is a better measure of how we invest than the S&P 500 or the Dow, rose just over 6% during the second quarter. Tack on the gain of just over 6% during the first quarter, and the average diversified U.S. stock fund is up over 12% as of June 30th.
International stocks also gained, with the average diversified international stock fund up nearly 3% during the second quarter. Adding the gain from the first quarter means the average international stock fund is up over 11% for the first half of the year.
Investors, still risk-averse after pretty much everything lost money in 2022, plowed nearly $59 billion into bond funds during the second quarter. Over $44 billion was pulled out of U.S. funds and less than $1 billion made its way into international stock funds. The average intermediate-term bond fund lost just under 2.0% during the second quarter. Adding the gain from the first quarter leaves the average intermediate-term bond fund up just over 2% as of June 30th.
Returns By Broad Category
Can't read this? Here's a link to a PDF of this chart.
The chart above provides a high-level view of how the broad asset categories have fared annually from 2008 - 2022 and the first half of 2023 (the column labeled "YTD"). The category titled "Asset Alloc." refers to a 60% stock, 40% bond portfolio.
I love this chart and always look forward to seeing the updated version. Two takeaways:
Notice any patterns? If you answered "yes", we need to talk because your brain operates on a different level than mine. It's impossible to consistently predict which categories will perform best from year-to-year or month-to-month.
This chart is Exhibit A for why it's prudent to build diversified portfolios. Sadly, diversification means you're always having to say you're sorry because it's rare for every category to produce positive returns.
As far as the chart goes, the "winners" for the first half of 2023 are everything but commodities.
The "R" Word
I've had a few clients ask me about the dreaded "R" word (recession). I've seen dozens of stories predicting a recession later this year or sometime in 2024. When thinking about what's in store for investors, I try to keep in mind this quote from economist Paul Samuelson: "Economists have predicted 9 out of the last 5 recessions".
In other words, no one knows with 100% certainty when the next recession will hit. There will be another recession, but it could be later this year...or five years from now.
Rather than dwell on doom & gloom scenarios, and the many other uncertainties facing investors today, I recommend focusing on things you can control:
Stick to your financial plan. If you're a client, you already have a financial plan in place - one that takes downturns into consideration. If you're still concerned, or if something in your life has changed, you can always contact me. Not a client? Feel free to schedule an initial consultation if you want to talk about creating a financial plan.
Don't check your portfolio daily, weekly, or even monthly. Investing is a marathon, not a sprint.
Steer clear of financial "news" from sources like CNBC.
Have surplus cash to invest?* If so, just keep buying.
*Of course this comes after you've built up your emergency fund, saved for retirement, set aside money for other goals, and paid down debts.
First Quarter 2023 In Review
Summary
2022 ended and one could almost hear investors breathe a sigh of relief. 2023 got off to a good start, with financial markets rebounding from the lows in 2022. Megacap companies, such as Alphabet, Apple, Meta, and Microsoft led the way in the recovery as they reported mostly strong earnings, layoffs (reducing expenses), and, in the case of Alphabet and Microsoft, new artificial intelligence (AI) tools, such as ChatGPT (it's an interesting tool, one I've enjoyed playing with, but I don't think we have to bow before our new AI overlords...yet).
Things were humming along nicely until the threat of a new banking crisis formed as Silicon Valley Bank (SVB) failed due to a run on the bank. Think "It's a Wonderful Life" but with many more venture capitalists. That, of course, is an overly simplified version of what actually happened at SVB. Many individuals and businesses were impacted negatively by the bank run. Fortunately, the federal government stepped in to guarantee all deposits at SVB and Signature Bank, another bank that collapsed, before the contagion could spread.
While the banking crisis took over the news, the debt ceiling fight in Congress got pushed to the back burner. Expect to hear a lot more about this issue in the coming weeks. Let's hope our elected officials come to their senses before they harm the economy and financial markets.
The Federal Reserve continued raising interest rates throughout the first quarter as inflation continued to cool. Based on the most recent statement from the Fed, it appears they be nearing the end of this cycle of rate hikes.
Ultimately, it was a good quarter for global markets across the board.
First Quarter 2023 Numbers
If you recall, the average diversified U.S. stock fund, which is a better measure of how we invest than the S&P 500 or the Dow, was down over 18% for all of 2022. Finally some good news for investors: The average U.S. stock fund rose nearly 6% during the first quarter. Despite the gain, investors remained cautious about domestic stocks, pulling over $68 billion from funds in that category during the quarter.
International stocks, down 17% in 2022, also rose during the first quarter, with the average diversified international stock fund up a little over 8%, besting U.S. stocks. International stock funds saw inflows, over $10 billion, during the quarter.
Investors, concerned about U.S. stocks, invested nearly $67 billion into of bond funds during the first quarter. The average intermediate-term bond fund, down over 13% in 2022, gained about 3.0% during the first quarter.
Returns By Broad Category
Can't read this? Here's a link to a PDF of this chart.
The chart above provides a high-level view of how the broad asset categories have fared annually from 2008 - 2022 and the first quarter of 2023 (the column labeled "YTD"). The category titled "Asset Alloc." refers to a 60% stock/40% bond portfolio (often referred to as the 60/40 portfolio).
Year-to-date, the three top-performing categories are:
International developed markets ("DM Equity",+8.6%).
Large cap U.S. stocks (+7.5%).
International emerging markets ("EM Equity", +4.0%).
Note how the average 60/40 portfolio's returns are squeezed in between Large Cap and EM Equity. The 60/40 portfolio isn't dead (it never was).
I love this chart and always look forward to seeing the updated version. Two takeaways:
Notice any patterns? If you answered "yes", we need to talk because your brain operates on a different level than mine. It's impossible to consistently predict which categories will perform best from year-to-year or month-to-month.
This chart is Exhibit A for why it's prudent to build diversified portfolios. Sadly, diversification means you're always having to say you're sorry because it's rare for every category to produce positive returns.
Update: Series I Bonds
Last year, from May 1, 2022 through October 31, 2022, Series I Bonds rates peaked at 9.62%. That was an amazing rate in year that was lousy for investors. Demand for bonds was so great that the TreasuryDirect website crashed.
The rate declined to 6.89% from November 1, 2022 through April 30, 2023. While not as good as 9.62%, 6.89% was still pretty good.
As the saying goes, all good things must come to an end: The new rate from May 1, 2023 through October 31, 2023 is 4.30%. Okay, this rate isn't that bad because Series I Bonds are extremely low-risk investments. The downside is the opportunity cost of investing in stocks, which had a higher return during the first quarter.
Does it make sense to invest additional money in I Bonds? If you bought I Bonds last year, should you continue to hold your I Bonds, or is it better to redeem your bonds and invest elsewhere?
Like many things in finance the answer is "it depends".
In general, Series I Bonds might be a good investment for you if:
Your risk tolerance is relatively low. Perhaps you're a cautious investor who can't sleep at night when the market is volatile. Or maybe you're a retiree who needs to focus more on asset preservation rather than growth.
You have surplus cash to invest. Let's say you've set aside enough cash to cover at least 3-6 months (or more!) of living expenses AND you are maxing out your retirement savings AND you are investing regularly in a taxable brokerage account. If you're doing all of those things and you still have cash left over than Series I Bonds might be a good, ow-risk investment.
You don't need the cash for a 12 months, or longer. This one is important. The minimum holding period for Series I Bonds is 12 months. If you think you might need access to the cash earlier than 12 months, you should invest elsewhere.
It's impossible to capture everyone's unique situation using the three rules above. I'm happy to help you determine if Series I Bonds are right for you. Contact me if you want to chat.
Fourth Quarter & Full Year 2022 In Review
Summary
There's no way to sugarcoat it: 2022 was a lousy year for investors.
Here's how some of the big indices closed out the year:
S&P 500 Index (large cap U.S. stocks): -18.11%
Dow Jones Industrial Average (large cap U.S. stocks): -6.86%
Russell 2000 Index (small cap U.S. stocks): -20.44%
Nasdaq Composite Index (tech-heavy U.S. stocks): -33.10%
MSCI EAFE Index (international stocks): -14.45%
Barclays U.S. Aggregate (bonds): -13.01%
Despite posting net losses for the year, there was a ray of hope as most of the big indices actually rallied during the fourth quarter. The exception was the Nasdaq, which showed a slight loss:
S&P 500 Index (large cap U.S. stocks): 7.56%
Dow Jones Industrial Average (large cap U.S. stocks): 16.01%
Russell 2000 Index (small cap U.S. stocks): 6.23%
Nasdaq Composite Index (tech-heavy U.S. stocks): -1.03%
MSCI EAFE Index (international stocks): 17.34%
Barclays U.S. Aggregate (bonds): 1.87%
Way back in May, when it was obvious financial markets were really struggling, I wrote the following:
"Given the recent declines in the financial markets, I think it's a good time for a reminder: In the short run, investments don't always go up.
No one likes seeing losses in their portfolio, but it's unavoidable. Fortunately, we can zoom out and the long-term picture is an upward trend."
You can see this upward trend in action in this view of the S&P 500 Index from 1996 through 2022:
Can't read this? Here's a link to a PDF of this chart.
When looking at the chart, note the gains or losses for each of the green trend lines. Spoiler: The gains far outweigh the losses over this time period.
Full Year 2022 Numbers
The average diversified U.S. stock fund, which is a better measure of how we invest than the S&P 500 or the Dow, ended 2022 down just over 18%. Big tech stocks, such as Alphabet, Amazon, and Apple, were hit especially hard during the year, with the tech-heavy Nasdaq Composite Index down 33.1%. Investors, perhaps following a "buy the dip" approach, invested nearly $12 billion in U.S. stock funds during the year.
International stocks performed slightly less worse than domestic stocks, with the average diversified international stock fund down a hair over 17% during the year. Investors, perhaps spooked by geopolitical issues, appeared to have little faith in international stock funds. During the year, over $51 billion was withdrawn from funds in the category.
Bonds, typically considered "safe" investments, also had a lousy year. The average intermediate-term bond fund lost 13.5% during 2022. Investors, realizing bonds weren't "safe", pulled over $336 billion out of bond funds during the 2022.
Returns By Broad Category
Can't read this? Here's a link to a PDF of this chart.
The chart above provides a high-level view of how the broad asset categories have fared annually from 2008 - 2022.
The category titled "Asset Alloc." refers to a 60% stock, 40% bond portfolio. Note how the classic 60/40 portfolio, long considered an ideal allocation for retirees, was down nearly 14% in 2022. The financial media is on the case, writing articles with titles like, "Is the 60/40 Dead?" and "The 60/40 Portfolio is Officially Over". I disagree with those extreme takes, but my take, possibly titled "The 60/40 is Down This Year, But It's Fine - Especially If It's the Correct Allocation for Your Goals", won't generate clicks.
I love this chart and always look forward to seeing the updated version. Two takeaways:
Notice any patterns? If you answered "yes", we need to talk because your brain operates on a different level than mine. It's impossible to consistently predict which categories will perform best from year-to-year or month-to-month.
This chart is Exhibit A for why it's prudent to build diversified portfolios. Sadly, diversification means you're always having to say you're sorry because it's rare for every category to produce positive returns. This fact was especially true in 2022.
As far as the chart goes, the only "winners" for 2022 were commodities and cash, up 16.1% and 1.5%, respectively.
What's Next?
No one can predict what 2023, and beyond, will mean for financial markets and investors, so I'll keep it simple and repeat some of the things I've said previously:
Stick to your financial plan. If you're a client, you already have a financial plan in place - one that takes downturns into consideration. If you're still concerned, or if something in your life has changed, you can always contact me. Not a client? Feel free to schedule an initial consultation if you want to talk about creating a financial plan.
Don't check your portfolio daily, weekly, or even monthly. Investing is a marathon, not a sprint.
Steer clear of financial "news" from sources like CNBC.
Have surplus cash? If so, take advantage of the decline in financial markets by investing while things are on sale.
Third Quarter 2022 in Review
Summary
Way back in March of 2020, when the S&P 500 index was down 26% year-to-date, I wrote that investing is hard. I then clarified what I meant:
"When I say 'investing is hard', what I really mean is that staying invested is hard."
That sentiment is still true today, especially when you consider how financial markets have performed so far this year. During the third quarter, the S&P 500 Index fell just over 5.0%, the Dow declined over 6.0%, and the Nasdaq dropped by nearly 4.0%. As of September 30th, these indices are down 23.6%, 19.4%, and 31.9%, respectively.
Ouch.
Even bonds, normally considered "safe" investments, are down. For example, the Bloomberg U.S. Aggregate Bond Index fell 4.75% in the third quarter...and is now down 14.6% for the year.
The only categories of investments that have worked this year are energy and commodities. Both are typically extremely volatile, so I don't recommend maintaining large positions in these categories.
Third Quarter 2022 Numbers
The average diversified U.S. stock fund, which is a better measure of how we invest than the S&P 500 or the Dow, fell about 4.5% during the third quarter. Tack on the losses from the first and second quarters, and the average diversified U.S. stock fund is down nearly 25% as of September 30th.
International stocks performed worse than domestic stocks, with the average diversified international stock fund down over 10% during the third quarter. Adding the losses from the first and second quarters, the average international stock fund is down over 32% as of September 30th.
Investors pulled over $20 billion from both domestic and international categories.
Investors, perhaps realizing bonds weren't "safe", pulled nearly $34 billion out of bond funds during the third quarter. The average intermediate-term bond fund lost a little over 4.5% during the third quarter. When we add losses from the first and second quarters, the average intermediate-term bond fund is down 15% as of September 30th.
Returns By Broad Category
Can't read this? Here's a link to a PDF of this chart.
The chart above provides a high-level view of how the broad asset categories have fared annually from 2007 - 2021 and 2022 through September 30th (the column labeled "YTD").
The category titled "Asset Alloc." refers to a 60% stock, 40% bond portfolio. Note how the classic 60/40 portfolio, long considered an ideal allocation for retirees, is down nearly 20% YTD. The financial media is on the case, writing articles with titles like, "Is the 60/40 Dead?" and "The 60/40 Portfolio is Officially Over". I disagree with those extreme takes, but my take, possibly titled "The 60/40 is Down This Year, But It's Fine - Especially If It's the Correct Allocation for Your Goals", won't generate clicks.
I love this chart and always look forward to seeing the updated version. Two takeaways:
Notice any patterns? If you answered "yes", we need to talk because your brain operates on a different level than mine. It's impossible to consistently predict which categories will perform best from year-to-year or month-to-month.
This chart is Exhibit A for why it's prudent to build diversified portfolios. Sadly, diversification means you're always having to say you're sorry because it's rare for every category to produce positive returns.
As far as the chart goes, the only "winners" for 2022 are commodities and cash. Energy isn't broken out as a separate category.
Final Thoughts
I'll keep it simple and repeat some of the things I've said previously:
Stick to your financial plan. If you're a client, you already have a financial plan in place - one that takes downturns into consideration. If you're still concerned, or if something in your life has changed, you can always contact me. Not a client? Feel free to schedule an initial consultation if you want to talk about creating a financial plan.
Don't check your portfolio daily, weekly, or even monthly. Investing is a marathon, not a sprint.
Steer clear of financial "news" from sources like CNBC.
Have surplus cash? If so, take advantage of the decline in financial markets by investing while things are on sale.
Last Call for Series I Bonds at 9.62%
The current rate of 9.62% for Series I Bonds is available for purchases made by October 28, 2022. If you purchase by that date, you'll lock in the current rate for six months. If you buy after the 28th, you'll earn the new rate, which will be announced soon. I expect it to be high, but maybe not as high as 9.62%
If you're interested, here’s what you need to do:
Click on "Open an Account”.
Follow the instructions to open the account and link a bank account. I believe Treasury Direct sent an email with the account number and another to verify the new account.
Once the account has been opened, click on the “BuyDirect” tab near the top of the page.
Select Series I bonds and hit submit.
Input the amount you want to buy, up to $10K and hit submit. Notes:
The $10K limit is per Social Security number, so each spouse/significant other/child can buy $10K.
This also applies to trusts…if your trust has a different tax ID number than your own Social Security number.
The limit is $10K per Social Security number/tax ID number per calendar year. That means you can buy up to $10K in 2022 and again in 2023. Again, if you have the cash.
Important: The minimum holding period is 12 months.
The current rate of 9.62% will be adjusted at the end of October. If you buy now, the rate of 9.62% is guaranteed for 6 months.
Done! Enjoy earning 9.62%.
Aside from energy & commodities, this might be the best return investors see in 2022. The biggest hurdles are (a) having $10K+ in cash available and (b) the 12-month holding requirement. Otherwise, this is the safest, easiest way to invest right now.
Second Quarter 2022 In Review
Summary
Investors continued to endure a roller coaster ride in the financial markets during the second quarter. Unfortunately, the roller coaster was broken because it went mostly down. During the second quarter, the S&P 500 Index fell just over 16%, the Dow declined over 11%, and the Nasdaq dropped over 22%. As of June 30th, these indices are down 20.6%, 15%, and 32%, respectively.
No one likes seeing their investments decrease in value. But it happens. In fact, it happens every year. Check out this chart, which shows annual returns and intra-year declines in the S&P 500 from 1980 to 2021:
Can't read this? Here's a link to a PDF of this chart.
First, note the solid gray bars, which show the return of the S&P 500 Index every year from 1980 to 2021. Second, check out the red dots and numbers below the gray bars. The red numbers indicate the intra-year drops - the largest market drops during the year. As you can see, it's not unusual to experience a decline every year. Does this mean the S&P 500 Index, along with other indices and investments, will end the year in positive territory? No, but it is possible.
Second Quarter 2022 Numbers
The average diversified U.S. stock fund, which is a better measure of how we invest than the S&P 500 or the Dow, fell just over 16% during the second quarter. Tack on the loss of just over 6% during the first quarter, and the average diversified U.S. stock fund is down over 22% as of June 30th.
International stocks also declined, with the average diversified international stock fund down nearly 14% during the second quarter. Adding the loss from the first quarter, 8%, means the average international stock fund is also down over 22% for the first half of the year.
Investors pulled money from both categories, over $17 billion and $25 billion, respectively.
Investors, perhaps realizing bonds weren't a safe haven, pulled nearly $146 billion out of bond funds during the second quarter. The average intermediate-term bond fund lost a little over 5.0% during the second quarter. When we add the first quarter loss, about 6%, that leaves the average intermediate-term bond fund down over 11% as of June 30th.
Perhaps the silver lining here, and this is really a stretch, is the loss in bond funds didn't match the loss of 22% found in both U.S. and international stock funds. I'm trying to be optimistic!
Returns By Broad Category
Can't read this? Here's a link to a PDF of this chart.
The chart above provides a high-level view of how the broad asset categories have fared annually from 2007 - 2021 and the first half of 2022 (the column labeled "YTD"). The category titled "Asset Alloc." refers to a 60% stock, 40% bond portfolio.
I love this chart and always look forward to seeing the updated version. Two takeaways:
Notice any patterns? If you answered "yes", we need to talk because your brain operates on a different level than mine. It's impossible to consistently predict which categories will perform best from year-to-year or month-to-month.
This chart is Exhibit A for why it's prudent to build diversified portfolios. Sadly, diversification means you're always having to say you're sorry because it's rare for every category to produce positive returns.
As far as the chart goes, the only "winners" for the first half of 2022 are commodities and cash.
Final Thoughts
Last quarter, I wrote, "If there's one thing investors hate, it's uncertainty." Well, that statement is still true. Investors continue to grapple with the following questions:
When will inflation reverse course? Spoiler: Not yet. The U.S. inflation rate was 9.1% in June, the highest on record since November of 1981.
How much will the Fed have to raise interest rates to get inflation under control? It depends on the monthly inflation numbers. I expect rate increases to become smaller, and eventually decline, once monthly inflation number shows a consistent downward trend.
When will problems with the supply chain end? September 17th, 2022. Just kidding. No one knows, but seems as if the situation is beginning to improve, especially now that COVID-related disruptions are on the decline.
What's the deal with Elon Musk? I have no idea.
Rather than dwell on these questions, and the many other uncertainties facing investors today, I recommend focusing on things you can control:
Stick to your financial plan. If you're a client, you already have a financial plan in place - one that takes downturns into consideration. If you're still concerned, or if something in your life has changed, you can always contact me. Not a client? Feel free to schedule an initial consultation if you want to talk about creating a financial plan.
Don't check your portfolio daily, weekly, or even monthly. Investing is a marathon, not a sprint.
Steer clear of financial "news" from sources like CNBC.
Have surplus cash? If so, take advantage of the decline in financial markets by investing while things are on sale.
Perspective
Given the recent declines in the financial markets, I think it's a good time for a reminder: In the short run, investments don't always go up.
No one likes seeing losses in their portfolio, but it's unavoidable. Fortunately, we can zoom out and the long-term picture is an upward trend.
To demonstrate this, I built a basic portfolio, 80% stocks and 20% bonds, using three investments:
60% Vanguard Total Stock Market Index ETF (VTI)
20% Vanguard Total International Stock Market Index ETF (VXUS)
20% Vanguard Total Bond Market Index ETF (BND)
Below, you'll find two charts. The first chart shows performance of the 80/20 portfolio from January 1st, 2022 through May 6, 2022. The second chart shows performance of the 80/20 portfolio from May 7, 1997 through May 6, 2022 (25 years!) and includes five events that had a negative impact on the financial markets.
For investors, living through those events was painful. However, the markets bounced back, creating the positive upward trend that's clearly visible.
Year-to-date return of a portfolio invested in 80% stocks and 20% bonds.
25-year return of a portfolio invested in 80% stocks and 20% bonds.
What Should Investors Do?
In my opinion, here are the best things you can do when dealing with declines in the financial markets:
Do nothing. Stay invested and stick to your financial plan.
Continue to invest. Everyone likes buying things when they're on sale. Here's your opportunity!
Stop checking the balance of your portfolio. Remember, the long-term trend is upward, but the day-to-day, week-to-week, and month-to-month performance of your investments will be all over the place.
Turn off the financial "news". Financial media, such as CNBC, loves when markets are volatile. Please ignore their "experts".
Consider tax-loss harvesting. This is a somewhat advanced strategy that involves selling a taxable investment at a loss to offset realized capital gains or up to $3,000/year of earned income. Talk to your financial planner about this option.
First Quarter 2022 In Review
Summary
Investors endured a lot over the last three years: A global pandemic (which is still hanging around), supply chain problems (also still here), rising inflation (probably still rising), and Elon Musk's shenanigans (no sign of stopping). Despite all of those things, global financial markets were surprisingly resilient, delivering three straight years of big gains. In case you need a refresher, the S&P 500 Index, a reasonable proxy for "The Market", had the following returns over the past three years:
2019: 31.49%
2020: 18.40%
2021: 28.71%
2022 got off to a decent start. People were vaccinated, shutdowns were easing, and people were starting to travel again. Sure, the problems listed above were still with us, and the Fed was threatening to raise interest rates in order to combat inflation, but things were looking up. Unfortunately, I don't think many people had "Russia invades Ukraine" on their bingo cards.
If there's one thing investors hate, it's uncertainty. And the invasion injected plenty of uncertainty into people's everyday lives as supply chains were strained further, global payment systems were disrupted, and energy prices skyrocketed. Tack on rate hikes from the Fed and the result was a decline in stocks and bonds during the first quarter, with the Dow Jones Industrial Average down 4.6% and the S&P 500 down 4.9%.
No one likes seeing their investments decrease in value. But it happens. I believe this time might feel worse because we've had such an incredible run over the past three years. Hang in there. Everything will be fine.
First Quarter 2022 Numbers
The average diversified U.S. stock fund, which is a better measure of how we invest than the S&P 500 or the Dow, fell just over 6% during the first quarter.
International stocks also declined, with the average diversified international stock fund down a little over 8% during the first quarter.
Despite the declines in both domestic and international stocks, investors plowed money into both categories, about $70 billion and $31 billion, respectively.
Investors, perhaps realizing bonds weren't a safe haven, pulled nearly $89 billion out of bond funds during the first quarter. The average intermediate-term bond fund lost almost 6.0% during the first quarter.
Returns By Broad Category
Can't read this? Here's a link to a PDF of this chart.
The chart above provides a high-level view of how the broad asset categories have fared annually from 2007 - 2021 and the first quarter of 2022 (the column labeled "YTD"). The category titled "Asset Alloc." refers to a 60% stock/40% bond portfolio.
I love this chart and always look forward to seeing the updated version. Two takeaways:
Notice any patterns? If you answered "yes", we need to talk because your brain operates on a different level than mine. It's impossible to consistently predict which categories will perform best from year-to-year or month-to-month.
This chart is Exhibit A for why it's prudent to build diversified portfolios. Sadly, diversification means you're always having to say you're sorry because it's rare for every category to produce positive returns.
Series I Bonds
Over the past few weeks I've received many inquires about Series I Bonds. Why? Because the current interest rate, through April, is 7.12%. That's a fairly amazing rate for what is nearly a risk-free investment.
Should you buy I Bonds? Like many things in finance the answer is "it depends".
I Bonds might be a good investment for you if:
You have set aside enough cash to cover at least 3-6 months (or more!) of living expenses.
You can afford to hold the I Bonds for 12 months, which is the minimum holding period.
Three more things:
The maximum amount you can purchase is $10,000/year per person. That means a couple can purchase up to $20,000/year.
The actual details about how much you can purchase are a bit complicated. I don't want to confuse the situation by adding those details here, so please do not send me an email that starts off with something like "Well, actually...." because I'll roll my eyes and get angry. And you wouldn't like me when I'm angry.
I'm happy to help you determine if I Bonds are right for you. Contact me if you want to chat.
Mr. Market's Wild Ride
People in the crypto space like to use the acronym "FUD" (fear, uncertainty, and doubt) when referring to negative happenings in investments or financial markets. It's safe to say FUD has crept into most markets. Caused by a reaction to central bank inflation, high debt levels, weak economic growth, geopolitical tensions, incompetent political parties, and continual bureaucratic intervention.
Nine days before Black Monday (the initial October 28, 1929 crash) Yale economist Irving Fisher said “Stock prices have reached what looks like a permanently high plateau.” It’s one of the worst market readings ever. Of course, our markets had a very rough decade. Nobody knows what that market is going to do over three days or three years… but we have a pretty good idea of what will happen over three decades. Time IN the market is wise, timing the market is human but foolish. While invested, we should be prepared for anything.
Major market movements present opportunities to reconnect with the basic principles of investing, such as having (and sticking with!) an investing strategy, diversifying one's investments, letting the magic of compounding work for you, and keeping investment expenses low. These principles are important because nobody knows what is going to happen next. Legendary investor, and perma-bear, Jeremy Grantham thinks we may have a Wild Rumpus, but he's been calling for the bubble to burst since 2016. Maybe he's correct this time. Again, nobody knows what is going to happen next, so the best course of action is to stay calm and stick to one's plan.
Here are the questions and topics I encourage investors to think through on a regular basis - not just when there's FUD in the financial markets:
Goals
What is this specific money for?
(What Values, Intentions, Purposes, or Goals does it support?)Have your goals changed?
(We should always match our investments to specific goals.)What is the timeline? (Your investment and goal should always be connected to a timeline.)
Risk
Is your real Risk Preference at the moment a lot lower than your Risk Tolerance when thinking about a possibility? Is it a lot scarier now that it is happening? There is the risk your wallet can mathematically handle (Risk Capacity), the risk your head thinks it can handle, and the risk your stomach can actually handle. You have to find the optimum point in that triangle for you and your spouse, and it is usually at the lower end.
Portfolio & Planning
Is it time to rebalance your portfolio? (You can also rebalance by adding.)
Is it a good time to invest a little more?
Does this show you that you need some liquidity?
Are you SURE you want to sell into weakness and realize what is right now probably a temporary paper loss?
Asset Class Diversification helps protect against many other returns you don’t see like the sequence of return risk. (Yes, you need bonds, cash, and other non “growth” assets. Retirees need even more fixed income. You draw from the well that is currently full.)
If you have a lot of individual investments you should be looking at tax-loss harvesting, your investment manager should have already done it.
Crypto markets are highly volatile, that is why they can return so much. High risk, high reward- but high risk. This is probably the first true crypto winter, and that’s okay. There is a real utility and infrastructure built into the system, the exchange rails are operating properly, and communities are going about their business. The value of the token dropping because of irrational fear, or the value skyjacking because of irrational exuberance does not change the underlying utility and value. Flippers and bubbles cause disruption, but they don't stop the real work from being done underneath. (Here's a good short article on viewing crypto risk in relation to other assets.)
Market timing is usually a fool’s errand. Here's a good (fictional) example.
Stick To Your Plan
If you're a client, you already have a financial plan in place and you know you can always contact me to discuss the things mentioned above.
Not a client? Feel free to schedule an initial consultation if you want to talk about creating a financial plan.
Fourth Quarter & Full Year 2021 In Review
Summary
In general, I believe 2021 was an improvement over 2020. COVID is still with us, but vaccines and healthcare workers, with improved knowledge about how to help the sick, made life feel somewhat normal again. Travel, even if somewhat limited, was possible and Costco had toilet paper in stock. Unfortunately, broken supply chains and staffing shortages were common throughout 2021 and will continue into 2022.
Inflation became a major topic of news headlines throughout the year. How high will it go? Answer: 6.9% annualized in CPI in November. Is it transitory? Answer: It depends on what the meaning of the word "transitory" is. For what it's worth, I don't expect hyperinflation. I believe what we're seeing is a result of a global pandemic, supply chain problems, and a labor shortage. Prices of goods and services will rise, and stay that way because no one lowers prices, but I doubt we'll see runaway inflation.
On the bright side, investors experienced a rare treat in 2021: The third straight year of big gains. The S&P 500 Index, a reasonable proxy for "The Market", had the following returns over the past three years:
2019: 31.49%
2020: 18.40%
2021: 28.71%
The last time investors experienced returns similar to this was just before the Dot-Com bubble burst in early 2000:
1995: 37.58%
1996: 22.96%
1997: 33.36%
1998: 28.58%
1999: 21.04%
An optimist will compare these periods and come to the conclusion we're in for another year of great returns. A pessimist will say a correction is imminent. Which one is correct? I don't know, but this is a good time to remind you that past performance is no guarantee of future returns.
Fourth Quarter 2021 Numbers
The average diversified U.S. stock fund, which is a better measure of how we invest than the S&P 500 or the Dow, gained nearly 7% during the fourth quarter. In total, the gain for the year was nearly 23%. This is especially impressive considering the average U.S. stock fund gained just over 19% in 2020 and over 28% in 2019. As I mentioned above, gains of ~20%+ for three years in a row are rare and may not necessarily continue. But they could! We'll find out in a little less than 12 months.
International stocks also performed well, just not as impressively as domestic stocks: The average diversified international stock fund gained a little over 2% during the fourth quarter, which translated to a gain of nearly 10% for the year.
Investors were cautious, pouring nearly $600 billion into bond funds during 2021. Unfortunately, the average intermediate-term bond fund lost 0.2% during the fourth quarter, which increased the overall loss to 1.3% for the year.
Returns By Broad Category
Can't read this? Here's a link to a PDF of this chart.
The chart above provides a high-level view of how the broad asset categories have fared annually from 2007 - 2021. The category titled "Asset Alloc." refers to a 60% stock/40% bond portfolio.
I love this chart and always look forward to seeing the updated version. Two takeaways:
Notice any patterns? If you answered "yes", we need to talk because your brain operates on a different level than mine. It's impossible to consistently predict which categories will perform best from year-to-year or month-to-month.
This chart is Exhibit A for why it's prudent to build diversified portfolios. Sadly, diversification means you're always having to say you're sorry because it's rare for every category to produce positive returns.
What's Next?
I dislike making predictions about the financial markets or the economy, but here are my five of my best guesses for the coming year:
Volatility in the financial markets will continue. Investors should stay calm and stick to their financial plan.
The Fed will raise interest rates 3-4 times during 2022.
With rising rates, investors may shift assets from growth stocks to traditional value stocks.
Inflation fears will continue to drive headlines, but will ultimately settle in around 3-4%.
Digital assets, AKA crypto, will continue to attract money from investors and scrutiny from regulators. The technology and its uses will evolve rapidly as some projects die and other emerge.
The Fiduciary's Dilemma: How Should Financial Planners Talk To Clients About Crypto?
The Dark Tower
During the pandemic I reread The Dark Tower, Stephen King's eight-book series which blends the genres of fantasy, horror, science fiction, and Western. It's an impressive piece of work that I revisit every few years in either book or audiobook format.
The story follows Roland Deschain, the last gunslinger of Mid-World, as he searches for the Dark Tower. The epic tale includes multiple trips to our world and several parallel worlds. Somewhere around book three Roland begins to question his sanity because his mind holds true two different versions of events that happened in parallel worlds. The decisions he must make in the future depend heavily on which version of events are correct.
To be clear, I am not a gunslinger. Nor am I questioning my sanity. However, I am conflicted about about two truths:
Crypto is extremely risky and could end to significant losses.
Crypto, specifically the underlying blockchain technology, could revolutionize the financial system and, like the early days of the internet, it presents an incredible opportunity for investors.
How does a financial planner, one who cares about his clients and recommends well-diversified portfolios comprised mostly of index funds and the occasional individual stock, talk to clients about cryptocurrencies?
I'm Not Alone
Ask 10 different financial planners which investments to use in a portfolio and you'll receive 10 different answers, with some general overlap of ideas. The same is true of crypto. When it comes to this subject, the financial planning forums I frequent have had some lively discussions, with the most common responses being:
This is no different than the tulip mania of the 1600s!
There's something to the underlying technology, but this is way too risky for my clients!
My clients have been buying crypto on their own, but I won't provide advice about it!
It's probably time to begin talking about crypto with my clients!
My impression is that the subject of crypto is similar to the Dotcom tech bubble of the late '90s. I was in college during that time, so I don't know what financial planners were telling their clients. Obviously, some bought into the craze while others avoided tech stocks altogether.
For example, I recently listened to an interview with legendary investor Jeremy Grantham. He refused to buy tech stocks during that period and ended up losing 50% of his clients. Fortunately, his firm rebounded nicely in the aftermath of the bubble. In the end, he made the right call but I'm sure it was difficult for him to tell clients "no" while watching his business crumble.
Regardless of what advisors think about crypto, or whether or not cryptocurrencies are "investments", many of our clients are curious and some have already purchased crypto.
Digital Assets, Not Currencies
I'm intellectually curious about many subjects, including crypto, which I've taken to calling digital assets. Why digital assets instead of cryptocurrencies? While these assets can be used to pay for things, I cannot understand why anyone would pay for a good or service using a "currency" that has a history of fluctuating 20% or more in a short period of time, sometimes within 24 hours.
Over the past year I've done a lot of reading about digital assets; how they work, potential use cases, etc. During that time, I've come to believe the truth, like many things, is somewhere in the middle.
Some digital assets are definitely a scam (I'm looking at you, dog-themed tokens). Amazon survived and flourished after the Dotcom crash and I believe some digital assets will, too. I just don't know which ones.
Some industries will be revolutionized by the underlying technologies (banking, trading, and gaming require fast, secure transactions, which could be powered by blockchain technology). Unfortunately, the timing and scope of these changes are impossible to predict right now.
So What's the Best Approach?
I believe planners owe it their clients to have an open discussion about the considerable risks and potential upsides of digital assets. Here's a list of some of the most pressing issues:
Regulatory. When it comes to money, most governments have a vested interest in maintaining the status quo. This is especially true in the United States, where the dollar is used as a global reserve currency. Digital assets may not be banned, but they could be regulated to the point where their use is significantly diminished.
Obsolescence. If you think of digital assets as software or programmable money, it's possible that even better, more sophisticated forms could be created, quickly replacing older, obsolete digital assets.
Volatility. As I mentioned earlier, I cannot understand why anyone would spend an asset that could fluctuate wildly in value over short period of time.
Cyber risk. Buying digital assets via a mobile app isn't difficult, but there have been many cases of exchanges being hacked. I suspect exchanges will be targeted again, especially as investors and institutions pour money into this category.
Password and/or seed phrase management. Owners of digital assets can transfer their assets to a hardware wallet, also known as cold storage. Doing so can secure the asset but requires some technical expertise. More importantly, it requires proper management of passwords and seed phrases. I know many people who can barely remember the passwords to their Netflix accounts, let alone a wallet containing a potentially significant portion of their savings.
24/7 trading. Unlike traditional financial markets, trading in digital assets takes place 24/7. I'm not sure everyone will be willing to monitor their portfolio on evenings and weekends.
Takeaways
Are digital assets any different from the tulip mania of the 17th century or the Dotcom boom of the '90s? I don't know, but this surge may feel different from the others because we're living through a period of upheaval: the COVID-19 pandemic disrupted the world's systems, supply chains are broken, people are rethinking how and where they want to be employed, and the internet and social media have changed the ways in which we communicate and trade.
Digital assets have the potential to revolutionize industries and provide incredible opportunities and returns for investors. However, the risks are considerable and anyone buying or holding digital assets should familiarize themselves with the risks. The asset should fit within your financial plan and your risk tolerance. More importantly, you should never invest more than you can afford to lose.
As always, I'm happy to answer questions about this topic or any other.
Downtime
Here are some things that have my attention when I'm not working:
Listening:
Podcast: I started listening to a new podcast, How We Survive, which examines what's needed for the transition away from fossil fuels. The first episode is great if you've ever wondered where we're going to get enough lithium for all the batteries in our fancy electric cars and other devices.
Watching:
Dune. This week, the only entertainment that matters to me is Dune on HBO Max. I have high hopes for this adaptation of the sci-fi classic.
Third Quarter 2021 In Review
Summary
My favorite time of the year is finally here! I always look forward to cool weather, scary movies, Oktoberfest beers, and apple season.
While the run-up in the financial markets continued for much of the summer, the third quarter ended with an increase in volatility and with stocks finally pulling back from all-time highs. It was a good reminder that stocks don't always go up.
As I've written previously, September is often the worst-performing month for investors. Whether or not the September Effect is real is debatable, but this September certainly wasn't kind to investors.
I suspect volatility will continue as the world grapples with, among other things, unnecessary drama from our elected officials, COVID-19 and its variants, reluctance by (too) many to get vaccinated, ongoing supply chain woes, and employment/staffing hiccups.
Third Quarter 2021 Numbers
The average diversified U.S. stock fund, which is a better measure of how we invest than the S&P 500, declined about 1.0% during the third quarter of 2021. As I mentioned above, September was a rough month for investors, with the average U.S. stock fund dropping 4.0% during that month alone. When the first and second quarter returns are added to the third, the average diversified U.S. stock fund is up 14.5% as of September 30. Investors, perhaps concerned about continuing to invest at all-time highs, pushed only $9 billion into U.S. stock funds during the quarter.
International stocks were also down for the quarter: The average diversified international stock fund lost about 1.8%. As of September 30th international stocks are up 7.1%. Investors demonstrated more confidence in international stock funds by investing $59 billion in those funds during the quarter.
The average intermediate-term bond fund rose a whopping 0.01% during the third quarter. Overall, bond funds are still negative for the year, at just over 1.1%. Despite low/negative returns, investors plowed nearly $129 billion into bond funds over the three-month period.
Returns By Category
Need a magnifying glass to read this? No problem. Here's a link to a PDF of this chart.
The chart above provides a high-level view of how the asset categories performed for the years 2018 to 2020, January through September 2021, and year-to-date 2021.
I love this chart and always look forward to seeing the updated version. Two takeaways:
Notice any patterns? If you answered "yes", we need to talk because your brain operates on a different level than mine. It's nearly impossible to consistently predict which categories will perform best from year-to-year or month-to-month.
This chart is Exhibit A for why it's prudent to build diversified portfolios. Sadly, diversification means you're always having to say you're sorry because it's rare for every category to produce positive returns.
Fourth Quarter And Beyond
No one can predict what's in store for financial markets, but here are some things likely to affect investors in the coming months:
Interest rates. Fed officials have signaled they might raise interest rates in 2022. Investors shrugged when this announcement was made, but I won't be surprised if the market reacts negatively when rates are actually increased.
Supply chain woes. Looking for a new car? Good luck. Hoping to score a PlayStation 5? I assume I'll be able to buy one when the PlayStation 6 is announced. Consumers will probably continue to have a difficult time buying many products due to semiconductor shortages, staffing problems, and COVID-related closures.
Inflation. Is inflation truly transitory, or short-term, as the Fed and many economists would have us believe? We'll see. In the end, it might depend on your definition of short-term.
Regulation of cryptocurrencies. Will the U.S. of other governments move to regulate or ban cryptocurrencies? Or will there be a flood of new investment products and services. Time will tell, but I think an outright ban, at least in the U.S., is unrealistic because of the amount of money currently invested in the space.
Downtime
Here are some things that have my attention when I'm not working:
Listening:
Podcasts: The two podcasts I look forward to every week are Animal Spirits and The Compound & Friends. Both shows cover a wide range of financial topics, such as the economy, investing, and taxes.
Audiobooks: I'm currently listening to The Exponential Age: How Accelerating Technology is Transforming Business, Politics, and Society by Azeem Azhar, which has been interesting because I think humans have a difficult time understanding how exponential growth can affect things. I'm also re-listening to Snow Crash by Neal Stephenson. For a book published way back in 1992, it's amazing how much Stephenson got right about the internet, A.I. assistants, and the Metaverse.
Watching:
Squid Game. I just started watching this Korean series on Netflix. So far, it's great. Not for the squeamish.
Midnight Mass. This one's also on Netflix. Highly recommended for fans of scary movies or anything influenced by Stephen King.
First Quarter 2021 In Review
Summary
For investors, 2021 is off to a good start. That doesn't mean the first three months of the year have been smooth sailing. Despite hitting all-time highs, financial markets saw some big swings during the first quarter. The volatility might have made you nervous. That's understandable. Keep in mind that big swings are normal. Stocks don't always go up.
The gains in the prices of stocks, housing, and cryptocurrencies have caused some investors, economists, and financial pundits to bring up the dreaded b-word, bubble, again and again. Is this a bubble? I don't know. No one knows. Anyone who tells you they know this is a bubble, and when it will burst, is lying.
Here's what we do know, with at least a reasonable degree of certainty:
The COVID vaccines continue to be produced, shipped, and processed throughout the U.S. and the world
Vaccinated people will be able to slowly resume normal activities
Employment will pick up
The economy will continue to recover
Unless your life situation or goals have changed, you should stick to your financial plan, which includes maintaining a properly diversified portfolio of investments
First Quarter 2021 Numbers
The average diversified U.S. stock fund, which is a better measure of how we invest than the S&P 500 or the Dow, gained about 8.5% during the first quarter of 2021. Small cap stocks continued to shine, outperforming all other investment categories during the quarter. Investors, optimistic about a recovery, pushed $78 billion into U.S. stock funds.
International stocks were also up for the quarter: The average diversified international stock fund rose about 3.5%. Investors demonstrated confidence in international stocks funds by investing a little over $27 billion in those funds during the quarter.
The average intermediate-term bond fund declined nearly 3.0% during the first quarter. Despite the decline, investors plowed nearly $2255 billion into bond funds over the three-month period.
Returns By Category
Need a magnifying glass to read this? No problem. Here's a link to a PDF of this chart.
The chart above provides a high-level view of how the asset categories performed for the years 2012 to 2020, January through March 2021, and year-to-date 2021.
I love this chart and always look forward to seeing the updated version. Two takeaways:
Notice any patterns? If you answered "yes", we need to talk because your brain operates on a different level than mine. It's nearly impossible to consistently predict which categories will perform best from year-to-year or month-to-month.
This chart is Exhibit A for why it's prudent to build diversified portfolios. Sadly, diversification means you're always having to say you're sorry because it's rare for every category to produce positive returns.
Market Volatility and Investing
Need a magnifying glass to read this? No problem. Here's a link to a PDF of this chart.
In the Summary I noted the financial markets were volatile during the first quarter of 2021. In order to reinforce my comments about (a) ignoring short-term volatility and (b) maintaining a well-diversified portfolio, I'm sharing a chart from BlackRock.
The chart shows 1-year returns of stocks from 1930 - 2020. The obvious takeaway is that there are far more years with positive returns than negative. Less obvious, but perhaps more important to keep in mind, is that for any given year the markets probably had wild swings from day-to-day. Hang on and stick to your plan.
Finally, a client asked me to include a reference to WandaVision in my next post. So.....
3 Takeaways From the GameStop Debacle
This full-page ad for Robinhood was featured in the Tuesday edition of The Washington Post. It was also misleading, so I fixed it.
If you've been paying attention to the news over the last week, you've probably noticed GameStop has been in the news a lot. The company, which sells physical video games, consoles, and accessories, was involved in something called a short squeeze. The story behind the debacle is more complicated than it appears and involves a large cast of characters, including hedge fund managers, professional traders at large institutional investment companies, securities regulators, regular Jane/Joe retail investors, and an army of angry, overzealous investors who organized on the WallStreetBets subreddit.
I'm not going to use this space to explain what happened and why; there are excellent summaries available to read online or, if you prefer audio, to listen to in podcast format. If you're interested, here are two good resources (the podcast provides an great timeline of what happened):
"The Whole Messy, Ridiculous GameStop Saga in One Sentence" by Derek Thompson of The Atlantic.
E19 of All-In with Chamath, Jason, Sacks & Friedberg: "Breaking Down Robinhood's GameStop Decision: Why did it happen and how can it be prevented in the future?". 1 hour, 26 minutes.
Again, I'm not going to summarize what happened. Instead, I want to highlight the three most important takeaways for investors.
#1: Wall Street Finds A Way
There's a scene in Jurassic Park where Dr. Ian Malcom (Jeff Goldblum) delivers the line "life finds a way". In the context of the movie the quote means that no matter what happens in life, species and nature will always find a way to reproduce and survive - even in nature's harshest conditions.
Wall Street operates in a similar manner. There are rules and regulations in place to ensure our free market system (which maybe isn't so free, but I'll get to that in takeaway #2) runs smoothly. For the most part, buying and selling of securities occurs on weekdays without too many hiccups. However, under extreme conditions, the rules can be changed in order to ensure the system continues to survive. For example, Robinhood made the surprising decision to restrict trading of shares in companies like GameStop, AMC, BlackBerry, and Nokia as shares of those companies hit new highs*.
For additional examples of Wall Street changing the rules mid-game, I recommend the book Business Adventures: Twelve Classic Tales from the World of Wall Street by John Brooks.
The takeaway: Wall Street will always do what is necessary in order for the system to survive. Unfortunately, some investors may be negatively impacted when the rules are changed.
*Without getting too wonky, I believe Robinhood was forced to restrict trading of certain companies because it was undercapitalized.
#2: Zero-Commission Doesn't Mean Free
Robinhood was one of the first companies to offer zero-commission trades for stocks and ETFs. The move placed pressure on the large brokerage companies, so E*Trade, Fidelity, Schwab, and TD Ameritrade quickly followed suit.
Overall, I believe the elimination of trading fees was positive for investors. Trading fees, often a barrier to entry, have been falling for decades. Their elimination, combined with gamified trading apps like Robinhood, opened up investing to millions of people - especially younger investors.
But, as we've seen over the past week, there are downsides to zero-commission trades.
First, there's the behavioral aspect. Unburdened by trading fees, investors have been incentivized to trade more frequently. Millions of day traders, professional and amateur alike, can now buy and sell stocks and ETFs throughout the day.
Second, and most relevant in this case, is that zero-commission doesn't always mean free...and Robinhood is the poster child for "free" trading. That's because Robinhood generates revenue from high-frequency trading and payments for order flow, a practice whereby a broker receives compensation for directing orders to different parties for trade execution. For example, Robinhood earns significant revenue by directing trades and data to firms such as Citadel Securities*, who in turn use that data to front-run Robinhood's investors. This isn't illegal, but I believe it's a conflict of interest.
The takeaway: When it comes to trading, "free" doesn't always mean free. Investors should try to understand what service providers do with user data as well as how the company makes money.
*Citadel Securities was one of two firms that provided $2.75 billion to Melvin Capital, a hedge fund that was shorting GameStop and losing billions while the share price skyrocketed. An injection of cash like this is known as backstopping.
#3: Ignore FOMO
If you spend any time in r/WallStreetBets on Reddit, you'll find posts and screenshots from users bragging about their earnings from trades in companies like GameStop. Seeing other people earn money, sometimes big money, off of trading can inspire jealousy or fear of missing out (FOMO). Once the trading frenzy subsides, and you never know when that might be, someone is going to be left holding the bag, and that someone might just be you.
The takeaway: When you hear about others' investing successes, try to ignore FOMO. While some people made big money gambling on GameStop, the majority did not.
In Conclusion
To wrap up this post I'm going to drag out another pop culture reference: The Terminator. This time I'm going to paraphrase Kyle Reese:
"Wall Street can't be bargained with. It can't be reasoned with. It doesn't feel pity, or remorse, or fear. And it absolutely will not stop, ever, until you are dead."
Be careful when investing. If you don't know what you're doing I recommend educating yourself or, better yet, avoiding hot stocks that are probably too good to be true.
Or, to once again paraphrase Kyle Reese, "Come with me if you want to be a better investor".
2020 In Review; Or, It's the End of the World As We Know It (and My Portfolio Feels Fine)
Summary
2020 is finally over. And what a year it was! Among other things, we experienced:
A global pandemic
Virtual learning for many students
A significant decline in financial markets
The most rapid onset of unemployment in U.S. history
The release of a stimulus bill
A significant recovery/increase in financial markets
A presidential election
The creation, testing, and approval of multiple vaccines for COVID-19
Zoom fatigue
Despite all of that, the financial markets performed surprisingly well during 2020.
The previous sentence will provide little solace to anyone who (a) didn't own any investments during 2020, or (b) experienced unemployment due to COVID-19. If you owned investments andmaintained your job during 2020, this is a reminder of just how fortunate you are.
2020 Numbers
The average diversified U.S. stock fund, which is a better measure of how we invest than the S&P 500 or the Dow, gained more than 19% during 2020. This is remarkable considering the S&P 500 plummeted more than 34% over just 23 trading days in 2020, which is the fastest decline of that magnitude in history. Investors, justifiably spooked, pulled $258 billion from US stock funds during 2020.
International stocks also had a good year: The average diversified international stock fund rose nearly 13%. Investors demonstrated more confidence in international stocks funds by pulling out only $108 billion out of those funds during the year.
The average intermediate-term bond fund gained just over 8.0% during 2020. In a flight to safety, investors plowed nearly $445 billion into bond funds during the year.
Returns By Category
Need a magnifying glass to read this? No problem. Here's a link to a PDF of this chart.
The chart above provides a high-level view of how the asset categories performed monthly from January - December 2020 and for the full year of 2020.
I love this chart and always look forward to seeing the updated version. Two takeaways:
Notice any patterns? If you answered "yes", we need to talk because your brain operates on a different level than mine. It's nearly impossible to consistently predict which categories will perform best from year-to-year or month-to-month.
This chart is Exhibit A for why it's prudent to build diversified portfolios. Sadly, diversification means you're always having to say you're sorry because it's rare for every category to produce positive returns.
Winners and Losers
Here's what worked (winners) and what didn't (losers) in 2020:
For example, it's now obvious to investors that companies in the information technology category, such as Apple, Microsoft, and Zoom, performed well during 2020. While COVID-19 spread, employers and consumers had to rely on these companies for their work-from-home and entertain-from-home needs.
Another example of a winning category includes companies in the consumer discretionary sector. Stuck at home, consumers spent more money at online retailers like Amazon and Target. Home improvement companies, such as Home Depot and Lowes, also received a big boost as consumers spent time and money improving living spaces and upgrading home offices.
On the losing side, companies in the real estate sector had a rough year (see the chart above). Specifically, companies involved in commercial real estate lost business due to COVID-19-related slowdowns/shutdowns.
In retrospect, it's obvious why certain broad categories of investments or even specific companies were successful last year. During 2020, while so much about COVID-19 was unknown, it was nearly impossible to make these kinds of calls. Sure, minor course corrections could be made throughout the year, but knowing what to do with a high degree of certainty cannot be done consistently.
In March of 2020 I wrote that investing is hard. The takeaway from that post, focus on what you can control, is still true today.
2021
Sadly, my palantir is broken so I cannot tell you exactly what will happen in 2021. Here are some thoughts:
Barring further shenanigans or acts of insurrection, Joe Biden will be inaugurated on Wednesday, January 20th, 2021. The world will not end, as some have predicted. Nor will the U.S. suddenly become a liberal paradise, as others have predicted. Mr. Biden and his administration will do some good things and some bad things. Given the state of the U.S., it will be an extremely difficult job.
Another round of stimulus is likely to be passed in the weeks or months after Inauguration Day. The exact form, such as direct payments to taxpayers or infrastructure spending, is still up in the air.
There will be changes to taxes and regulations. These changes won't cause the end of the world.
Doses of the vaccines will continue to be produced and distributed, which will mean businesses and schools will be able to reopen. The economy will slowly recover for everyone.
As usual, investors will adapt to the changes listed above.
Minor course corrections to one's portfolio are appropriate, but you should stick to your financial plan.
Whenever I need a laugh I will re-watch an episode or two of Ted Lasso on Apple TV+. I suggest you do the same.
If you're a regular reader, you know that I often insert references to Star Wars or other pop culture sources. I'm a nerd, so that's not going to change. This is the way.
Some Reminders
Wear a mask.
Wash your hands.
Get some exercise. Every. Day.
Limit your social media intake. More specifically, don't get your news from social media.
Read a book.
Third Quarter 2020 In Review
Summary
Well, the third quarter is behind us. We just have to make it through three more months and then we can put 2020 behind us...unless, as in the comedy Palm Springs, this turns out to be "one of those infinite time-loop situations you might have heard about". Let's hope not.
The financial market performed surprisingly well during July and August. Unfortunately, September must have been sponsored by Debbie Downer because everything went south. Could this be attributed to The September Effect, which I wrote about last month? I don't know, but it's certainly another data point in favor of that particular market anomaly.
On the bright side, the first few days of October have given investors some positive returns. Will the trend continue? I don't know. My guess is that the rollercoaster ride will continue, especially as Election Day approaches. Uncertainty, which is still my contender for Word of the Year, isn't going away anytime soon. Hang in there.
Third Quarter 2020 Numbers
The average diversified U.S. stock fund, which is a better measure of how we invest than the S&P 500 or the Dow, gained more than 7% during the third quarter. In case you've forgotten, the average U.S. stock fund was down 25% during the first quarter and then up 24% during the second quarter. This is remarkable considering we're still in the middle of a pandemic and a train wreck of an election. Investors, justifiably spooked, pulled $121 billion from US stock funds during the third quarter.
International stocks fared about the same: The average diversified international stock fund rose nearly 7%, which follows a loss of 23% during the first quarter and a gain of 18% during the second quarter. Investors demonstrated more confidence in international stocks funds by pulling out only $17 billion out of those funds during the third quarter.
The average intermediate-term bond fund gained almost 1.0% during the third quarter, which added to its gain of 0.4% during the first quarter and 5% during the second. In a flight to safety, investors plowed nearly $218 billion into bond funds during the third quarter.
Returns By Broad Category
Need a magnifying glass to read this? No problem. Here's a link to a PDF of this chart.
The chart above provides a high-level view of how the broad asset categories have fared annually from 2017 - 2019, monthly from January - September 2020 and year-to-date 2020.
I love this chart and always look forward to seeing the updated version. Two takeaways:
Notice any patterns? If you answered "yes", we need to talk because your brain operates on a different level than mine. It's impossible to consistently predict which categories will perform best from year-to-year or month-to-month.
This chart is Exhibit A for why it's prudent to build diversified portfolios. Sadly, diversification means you're always having to say you're sorry because it's rare for every category to produce positive returns.
How Will The Election Affect The Market?
Every journalist, pundit, politician, and Average Joe/Jane has an opinion about how the election and the next president will affect the financial market. The reality is that no one knows what's going to happen in the coming weeks and beyond. Below, you'll find some information about what has happened in the past and what could be in store for investors:
What History Tells Us About U.S. Presidential Elections and the Market by Dimensional Fund Advisors:
It's natural for investors to look for a connection between who wins the White House and which way stocks will go. But as nearly a century of returns shows, stocks have trended upward across administrations from both parties.
Shareholders are investing in companies, not a political party. And companies focus on serving their customers and growing their businesses, regardless of who is in the White House.
U.S. presidents may have an impact on market returns, but so do hundreds, if not thousands, of other factors - the actions of foreign leaders, a global pandemic, interest rate changes, rising and falling oil prices, and technological advances, just to name a few.
Here's an interactive PDF produced by Dimensional that shows how the market has performed under every president from 1929 to today
Indecision 2020: The Potential for a 2000 Election Night Reboot by Matthew J. Bartolini, head of SPDR Americas Research
Bartolini does a deep dive into how a delayed election result might play out
A Few Reminders
Wear a mask.
Wash your hands.
Get some exercise. Every. Day.
Limit your social media intake.
Vote.